
Key figures
On this table, when a statistical test has been performed, the data showing a significant difference is displayed on a yellow background, otherwise on a grey background.
The geographical dispersion marker Δ shows the result of comparing the coefficient of variation (CV) of the indicator with the median (MED) of the CVs of all analyses for this indicator: δ if CV > MED + 10%, δδ if CV > MED + 20%, δδδ if CV > MED + 30% (Exception: For median age, δ means CV > MED + 30%).
Data
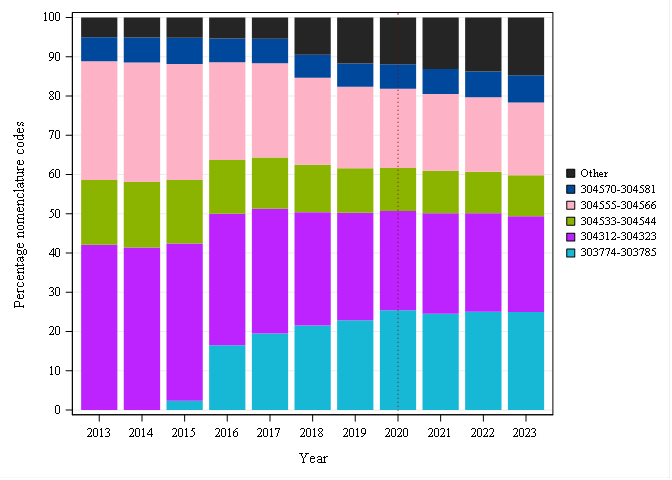
NIHDI nomenclature codes selected for analysis
| CODES | LABEL | CREATION | DELETION |
| 303774-303785 | ** Démarrage en urgence d'un traitement d'un ou de plusieurs canaux radiculaires d'une ou plusieurs dents définitives, y inclus les moyens de diagnostic utilisés, à partir du 19e anniversaire | 01-10-2015 | |
| 304312-304323 | ** Traitement et obturation d'un canal d'une dent chez le bénéficiaire à partir du 19e anniversaire | 15-01-1993 | |
| 304533-304544 | ** Traitement et obturation de deux canaux de la même dent chez le bénéficiaire à partir du 19e anniversaire | 01-05-1995 | |
| 304555-304566 | ** Traitement et obturation de trois canaux de la même dent chez le bénéficiaire à partir du 19e anniversaire | 01-05-1995 | |
| 304570-304581 | ** Traitement et obturation de quatre canaux ou plus de la même dent chez le bénéficiaire à partir du 19e anniversaire | 01-05-1995 | |
| 305012-305023 | ** Retraitement et obturation d’un canal d’une dent, chez le bénéficiaire à partir du 19e anniversaire | 01-02-2018 | |
| 305034-305045 | ** Retraitement et obturation de deux canaux de la même dent chez le bénéficiaire à partir du 19e anniversaire | 01-02-2018 | |
| 305056-305060 | ** Retraitement et obturation de trois canaux de la même dent chez le bénéficiaire à partir du 19e anniversaire | 01-02-2018 | |
| 305071-305082 | ** Retraitement et obturation de quatre canaux ou plus de la même dent chez le bénéficiaire à partir du 19e anniversaire | 01-02-2018 | |
| 305233-305244 | Honoraires complémentaires maximaux lors d’un traitement endodontique, en cas de score DETI classe B, documenté dans le dossier, pour une obturation radiculaire d’un canal | 01-01-2018 | |
| 305255-305266 | Honoraires complémentaires maximaux lors d’un traitement endodontique, en cas de score DETI classe B, documenté dans le dossier, pour une obturation radiculaire de 2 canaux | 01-01-2018 | |
| 305270-305281 | Honoraires complémentaires maximaux lors d’un traitement endodontique, en cas de score DETI classe B, documenté dans le dossier, pour une obturation radiculaire de 3 canaux | 01-01-2018 | |
| 305292-305303 | Honoraires complémentaires maximaux lors d’un traitement endodontique, en cas de score DETI classe B documenté dans le dossier, pour une obturation radiculaire de quatre canaux ou plus | 01-01-2018 | |
| 373634-373645 | ** Traitement suite à un trauma externe, du canal d'une incisive ou canine définitive avec racine immature, au moyen de la technique d'apexification, jusqu'au 19e anniversaire : première séance | 01-07-2013 | |
| 373656-373660 | ** Traitement et obturation, suite à un trauma externe, du canal d'une incisive ou canine définitive avec racine immature, au moyen de la technique d'apexification, jusqu'au 19e anniversaire : achèvement du traitement radiculaire avec un ciment biologique endodontique | 01-07-2013 | |
| 373774-373785 | ** Démarrage en urgence d'un traitement d'un ou de plusieurs canaux radiculaires d'une ou plusieurs dents définitives, y inclus les moyens de diagnostic utilisés, jusqu'au 19e anniversaire | 01-10-2015 | |
| 374312-374323 | ** Traitement et obturation d'un canal d'une dent chez le bénéficiaire jusqu'au 19e anniversaire | 01-09-2005 | |
| 374533-374544 | ** Traitement et obturation de deux canaux de la même dent chez le bénéficiaire jusqu'au 19e anniversaire | 01-09-2005 | |
| 374555-374566 | ** Traitement et obturation de trois canaux de la même dent chez le bénéficiaire jusqu'au 19e anniversaire | 01-09-2005 | |
| 374570-374581 | ** Traitement et obturation de quatre canaux ou plus de la même dent chez le bénéficiaire jusqu'au 19e anniversaire | 01-09-2005 | |
| 375012-375023 | ** Retraitement et obturation d’un canal d’une dent chez le bénéficiaire jusqu’au 19e anniversaire | 01-02-2018 | |
| 375034-375045 | ** Retraitement et obturation de deux canaux de la même dent chez le bénéficiaire jusqu’au 19e anniversaire | 01-02-2018 | |
| 375056-375060 | ** Retraitement et obturation de trois canaux de la même dent chez le bénéficiaire jusqu’au 19e anniversaire | 01-02-2018 | |
| 375071-375082 | ** Retraitement et obturation de quatre canaux ou plus de la même dent chez le bénéficiaire jusqu’au 19e anniversaire | 01-02-2018 | |
| 375233-375244 | Honoraires complémentaires maximaux lors d’un traitement endodontique, en cas de score DETI classe B, documenté dans le dossier, pour une obturation radiculaire d’un canal | 01-01-2018 | |
| 375255-375266 | Honoraires complémentaires maximaux lors d’un traitement endodontique, en cas de score DETI classe B, documenté dans le dossier, pour une obturation radiculaire de 2 canaux | 01-01-2018 | |
| 375270-375281 | Honoraires complémentaires maximaux lors d’un traitement endodontique, en cas de score DETI classe B, documenté dans le dossier, pour une obturation radiculaire de 3 canaux | 01-01-2018 | |
| 375292-375303 | Honoraires complémentaires maximaux lors d’un traitement endodontique, en cas de score DETI classe B documenté dans le dossier, pour une obturation radiculaire de quatre canaux ou plus | 01-01-2018 |
The codes mentioned above can be used in rates and expenses, or only in expenses. We invite you to consult the full report for more information.
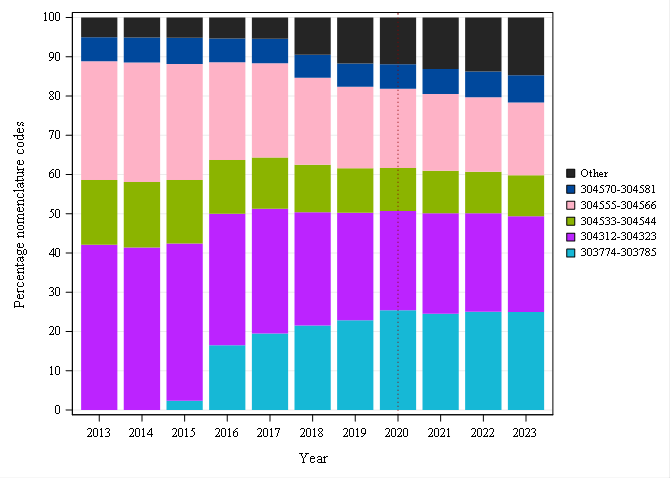
Below is a graph showing the evolution of the breakdown by volume of nomenclature codes used for the rates:
Population selection
No selection
Analysis period
2025
Graphics
 Nomenclature codes
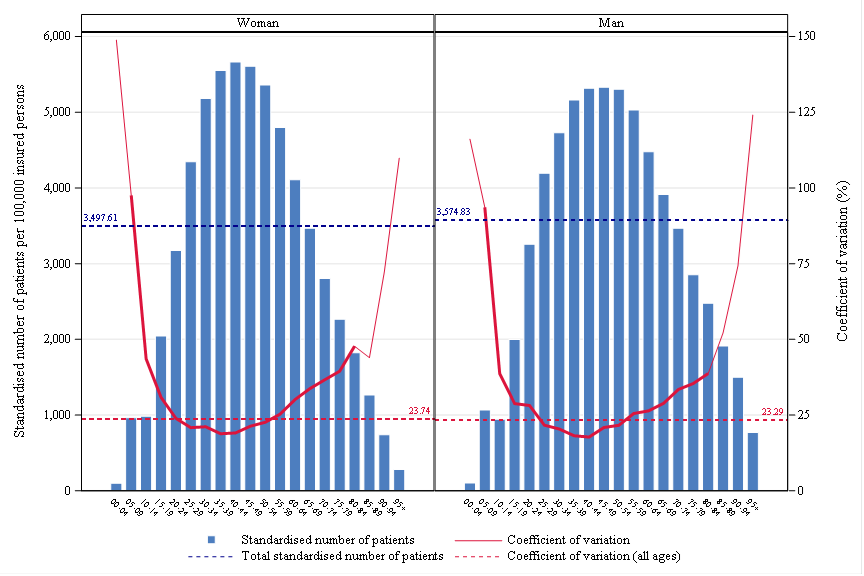
 Age, gender and CV
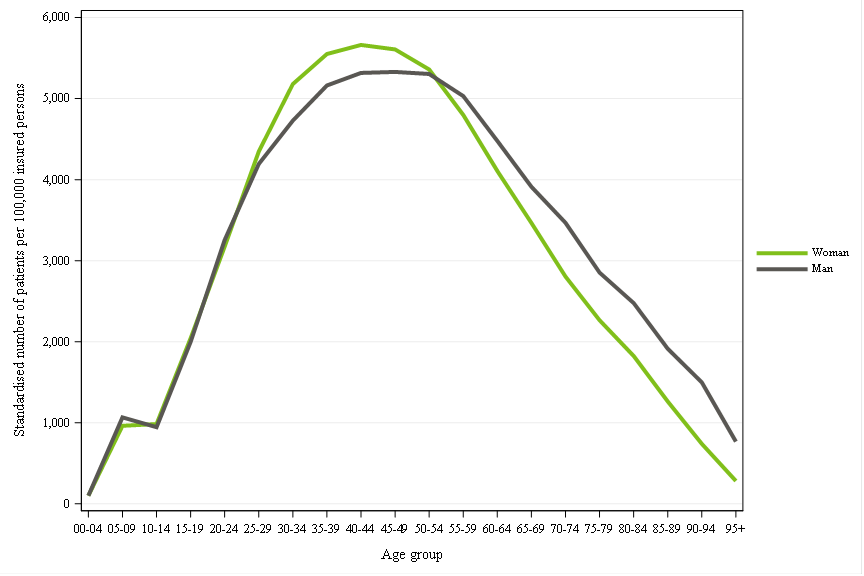
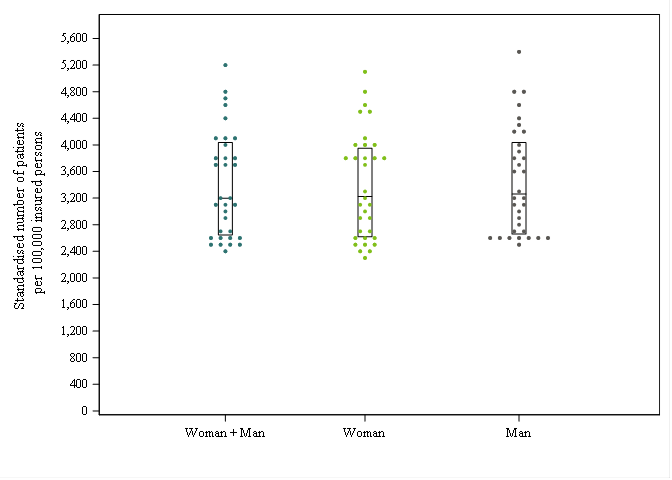
 Rates by sex
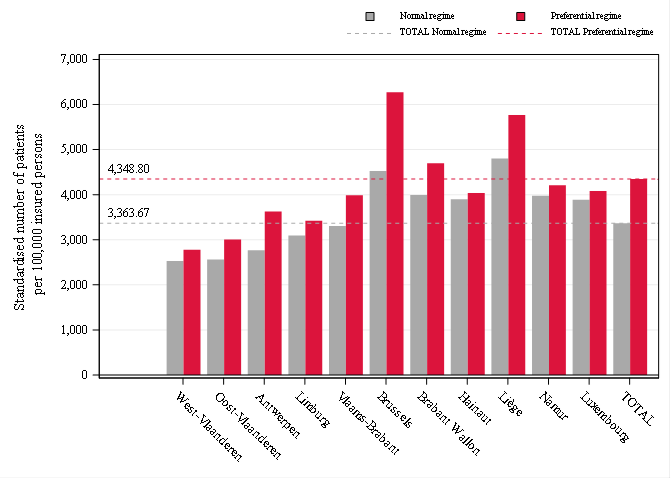
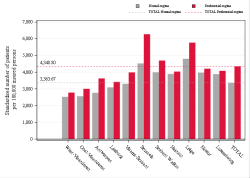 Reimbursement rate
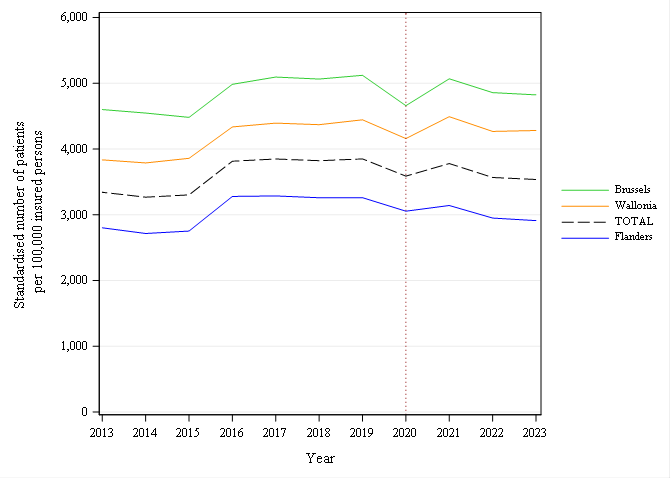
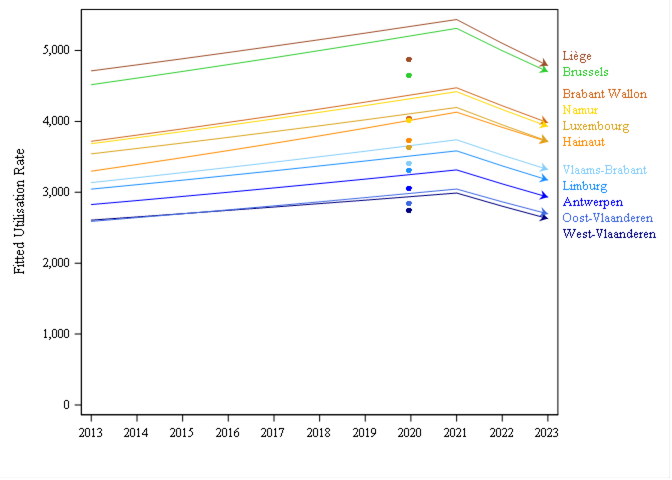
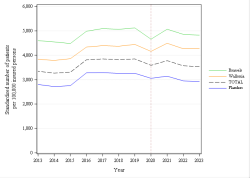 Trends by region
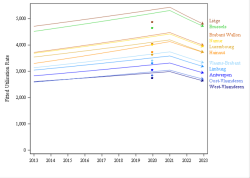 Trends break
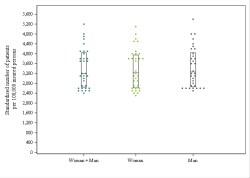 Dot Plot
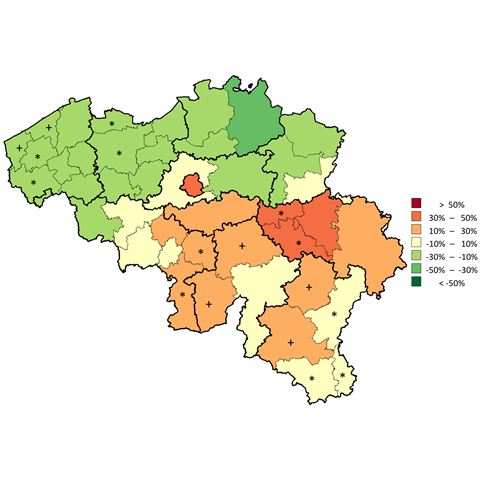
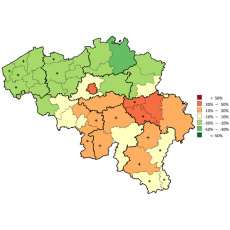 Distribution map
 Expenses Distribution map
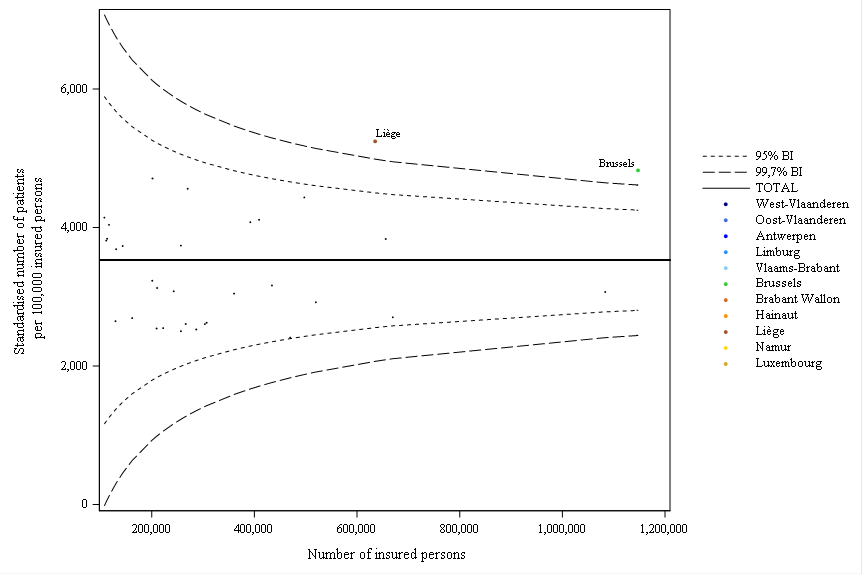
 Funnel plot
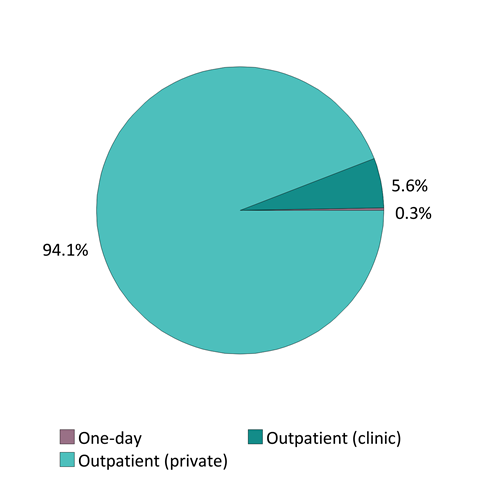
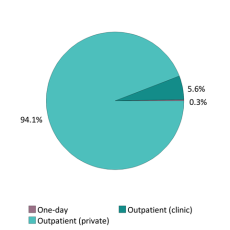 Patient care settings
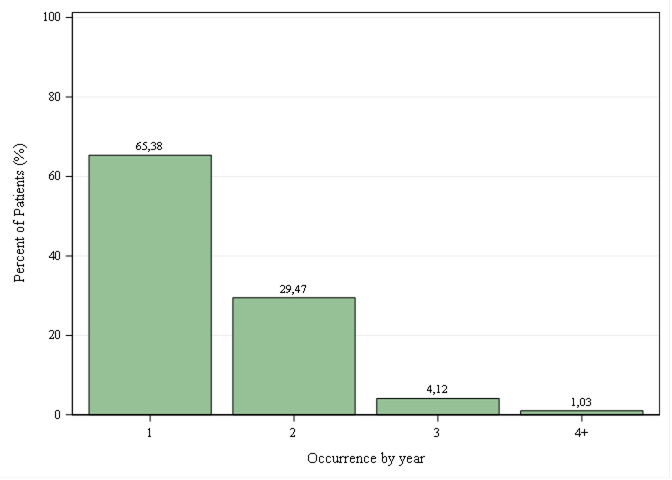
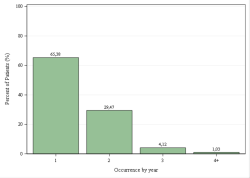 Occurrences per year
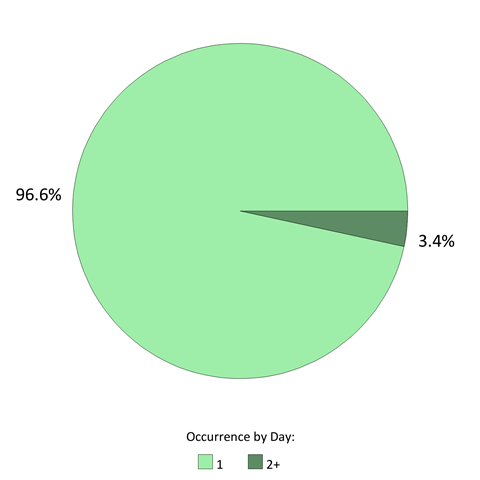
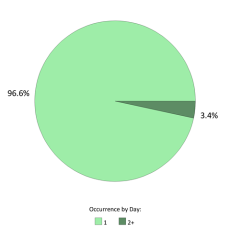 Occurrences per day











Comments
WE ARE INTERESTED IN YOUR OPINION
Do you have any experience in this area ? We listen to you !