Key figures
On this table, when a statistical test has been performed, the data showing a significant difference is displayed on a yellow background, otherwise on a grey background.
Data
NIHDI nomenclature codes selected for analysis
| CODES | LABEL | CREATION | DELETION |
| 301151 301162 |
* Extraction d’une dent, chez un patient à risque hémorragique répondant aux conditions de l’article 6 § 3bis de la nomenclature, à partir du 53e anniversaire, pour autant qu’une suture ait été effectuée | 01-01-2018 | 30-06-2022 |
| 301173 301184 |
* Extraction d’une dent, chez un patient à risque hémorragique répondant aux conditions de l’article 6 § 3bis de la nomenclature, à partir du 18e anniversaire jusqu'au 53e anniversaire, pour autant qu’une suture ait été effectuée | 01-01-2018 | 30-06-2022 |
| 301195 301206 |
* Extraction chirurgicale d’une dent définitive, à l’exclusion des incisives, avec résection de l’os environnant et suture des lambeaux muqueux incisés, à partir du 50e anniversaire | 01-01-2018 | |
| 301210 301221 |
* Extraction chirurgicale d’une dent définitive, à l’exclusion des incisives, avec résection de l’os environnant et suture des lambeaux muqueux incisés, à partir du 19e anniversaire jusqu’au 50e anniversaire, dans le cas où le bénéficiaire répond à une des conditions de l’article 6, § 3bis | 01-01-2018 | |
| 304850 304861 |
* Extraction d’une dent, y compris la suture éventuelle, à partir du 53e anniversaire | 01-06-2007 | 30-06-2022 |
| 304872 304883 |
* Extraction d’une dent, à partir du 50e anniversaire, par dent supplémentaire dans le même quadrant et au cours de la même séance | 01-06-2007 | |
| 304894 304905 |
* Extraction d’une dent, y compris la suture éventuelle, à partir du 18e anniversaire jusqu’au 53e anniversaire, dans le cas où le bénéficiaire répond à une des conditions de l’article 6, § 3bis | 01-06-2007 | 30-06-2022 |
| 304916 304920 |
* Extraction d'une dent, à partir du 19e anniversaire jusqu'au 50e anniversaire, dans le cas où le bénéficiaire répond à une des conditions de l'article 6, §3bis, par dent supplémentaire dans le même quadrant et au cours de la même séance | 01-06-2007 | |
| 304975 304986 |
* Extraction d’une dent, à partir du 50e anniversaire | 01-07-2022 | |
| 304990 305001 |
* Extraction d’une dent, à partir du 19e anniversaire jusqu’au 50e anniversaire, dans le cas où le bénéficiaire répond à une des conditions de l’article 6, §3bis | 01-07-2022 | |
| 305130 305141 |
Honoraires complémentaires pour suture de plaie pendant une séance d'extraction(s) dentaire(s) ou ablation (section et extraction) de racine(s), à l’exception des prestations où la suture est comprise, à partir du 19e anniversaire | 01-07-2022 | |
| 305152 305163 |
Honoraires complémentaires pour suture de plaie pendant une séance d'extraction(s) dentaire(s) ou ablation (section et extraction) de racine(s), à l’exception des prestations où la suture est comprise, par dent supplémentaire dans le même quadrant et durant la même séance, à partir du 19e anniversaire | 01-07-2022 | |
| 312410 312421 |
Ostéotomie autour d'une dent incluse par résection osseuse péricoronaire et, le cas échéant, lorsqu'une section dentaire est effectuée | 01-02-2004 | |
| 312432 312443 |
Ostéotomie au-dessus et autour d'un germe dentaire avec section dentaire éventuelle et enlèvement du germe dentaire | 01-02-2004 | |
| 317214 317225 |
+ Extraction sous anesthésie générale, de 8 dents au moins, y compris l'alvéolectomie et les sutures éventuelles | 01-04-1985 | |
| 317236 317240 |
+ ** Extraction de dent incluse | 01-04-1985 | |
| 317251 317262 |
+ Extraction, sous anesthésie générale, de moins de 8 dents, y compris l'alvéolectomie et les sutures éventuelles | 01-04-1985 | |
| 317376 317380 |
Extraction en milieu hospitalier de minimum 8 dents, y compris l'alvéolectomie et les sutures éventuelles, et ce sous monitoring des paramètres vitaux | 01-02-2004 | |
| 317391 317402 |
Extraction en milieu hospitalier de moins de 8 dents, y compris l'alvéolectomie et les sutures éventuelles, et ce sous monitoring des paramètres vitaux | 01-02-2004 | |
| 371151 371162 |
* Extraction d’une canine lactéale, d’une molaire lactéale ou d’une dent définitive, chez un patient à risque hémorragique répondant aux conditions de l’article 6 § 3bis de la nomenclature, jusqu’au 18e anniversaire, pour autant qu’une suture ait été effectuée | 01-01-2018 | 30-06-2022 |
| 371195 371206 |
* Extraction chirurgicale d'une dent définitive, à l'exclusion des incisives, avec résection de l'os environnant et suture des lambeaux muqueux incisés, jusqu'au 19e anniversaire | 01-01-2018 | |
| 374850 374861 |
* Extraction d’une canine lactéale, d’une molaire lactéale ou d’une dent définitive, y compris la suture éventuelle, jusqu’au 18e anniversaire | 01-06-2007 | 30-06-2022 |
| 374872 374883 |
* Extraction d'une canine lactéale, d'une molaire lactéale ou d'une dent définitive, jusqu'au 19e anniversaire, par dent supplémentaire dans le même quadrant et au cours de la même séance | 01-06-2007 | |
| 374975 374986 |
* Extraction d'une canine lactéale, d'une molaire lactéale ou d'une dent définitive, jusqu'au 19e anniversaire | 01-07-2022 | |
| 375130 375141 |
Honoraires complémentaires pour suture de plaie pendant une séance d'extraction(s) dentaire(s) ou ablation (section et extraction) de racine(s), à l’exception des prestations où la suture est comprise, jusqu’au 19e anniversaire | 01-07-2022 | |
| 375152 375163 |
Honoraires complémentaires pour suture de plaie pendant une séance d'extraction(s) dentaire(s) ou ablation (section et extraction) de racine(s), à l’exception des prestations où la suture est comprise, par dent supplémentaire dans le même quadrant et durant la même séance, jusqu’au 19e anniversaire | 01-07-2022 |
The codes mentioned above can be used in rates and expenses, or only in expenses. We invite you to consult the full report for more information.
Below is a graph showing the evolution of the breakdown by volume of nomenclature codes used for the rates:
")
Population selection
No selection
Analysis period
2023
Graphics
 Nomenclature codes
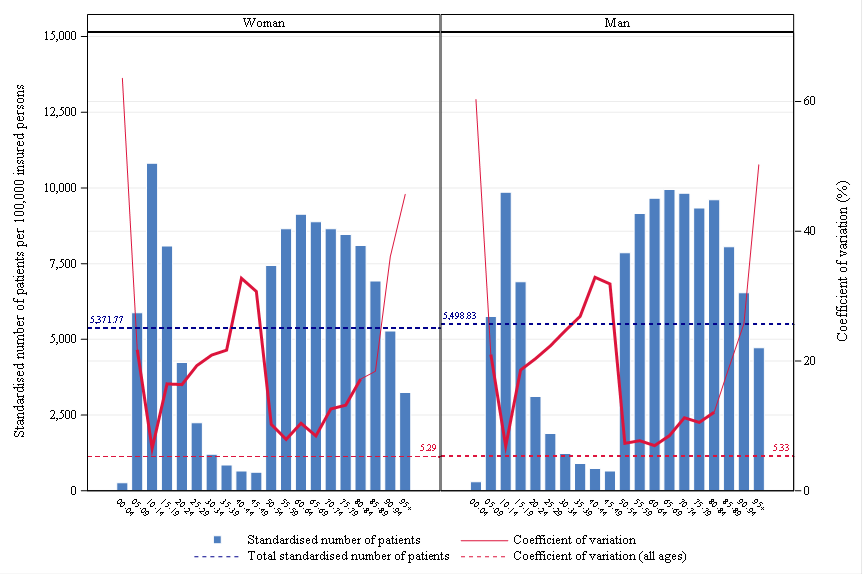
 Age, gender and CV
 Rates by sex
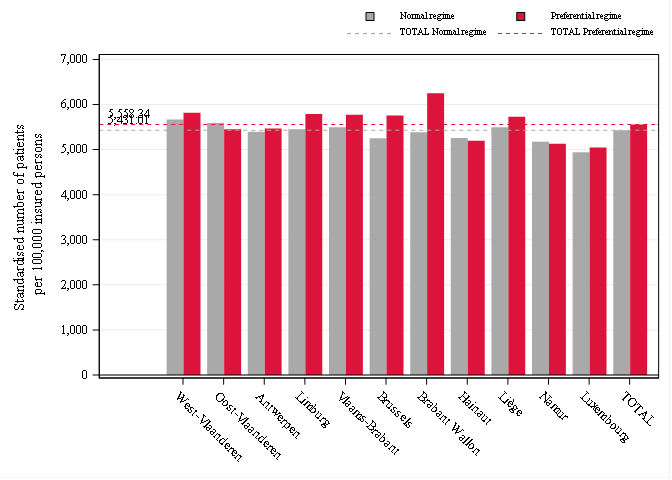
 Reimbursement rate
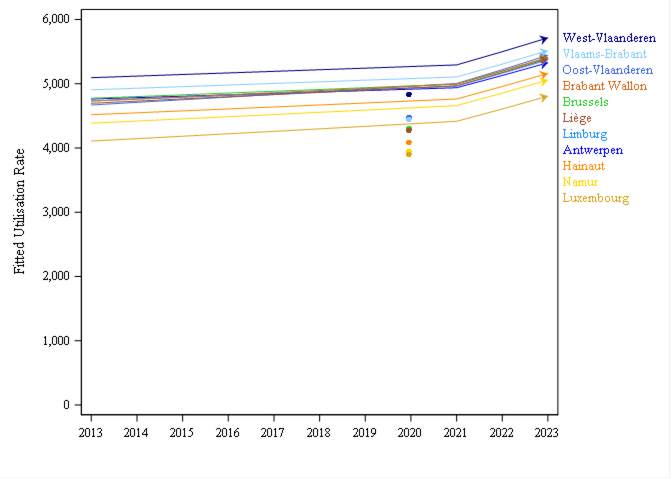
 Trends by region
 Trends break
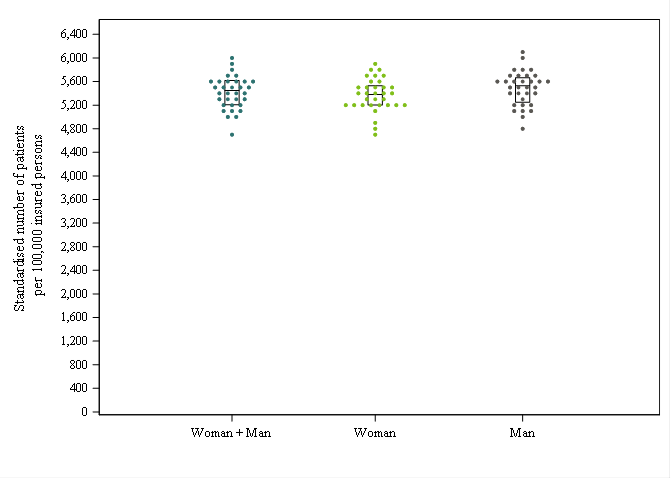
 Dot Plot
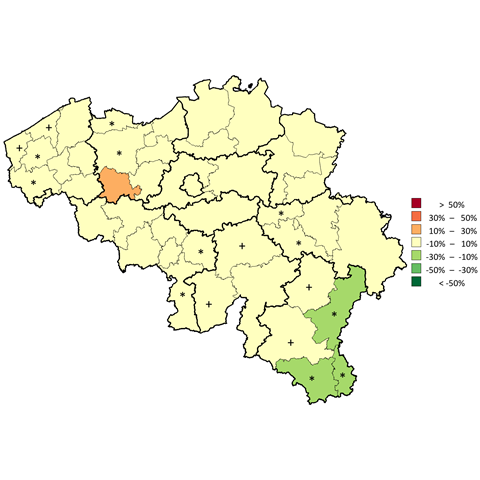
 Distribution map
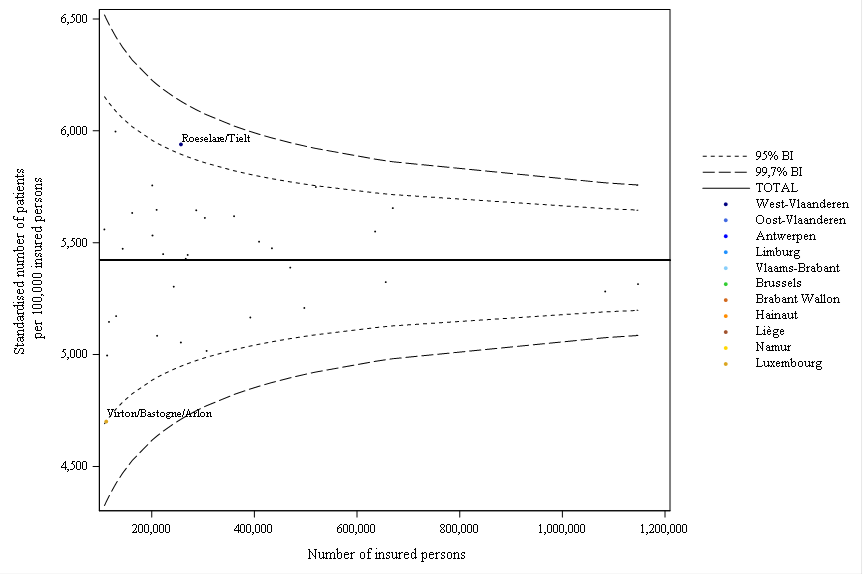
 Funnel plot
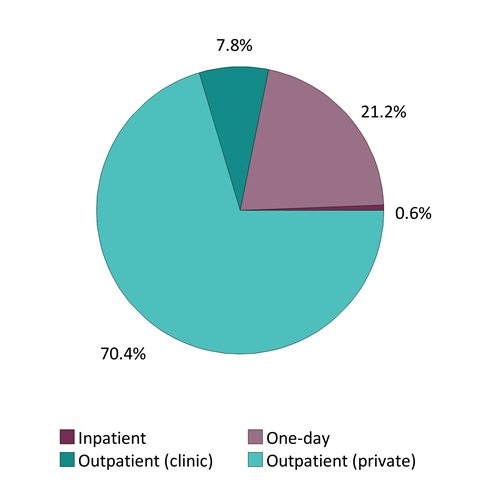
 Patient care settings
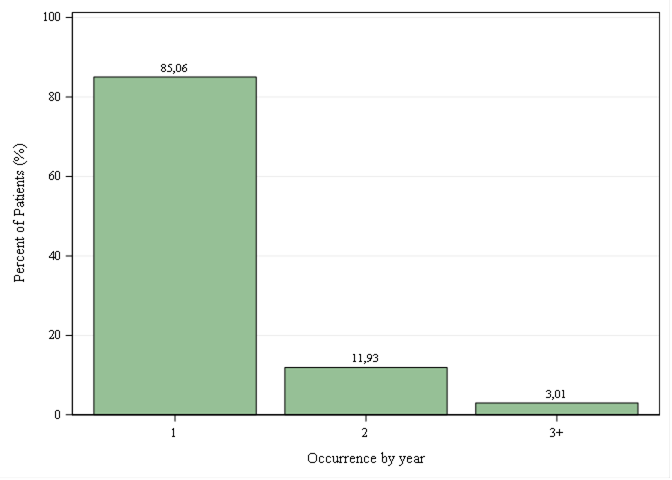
 Occurrences per year
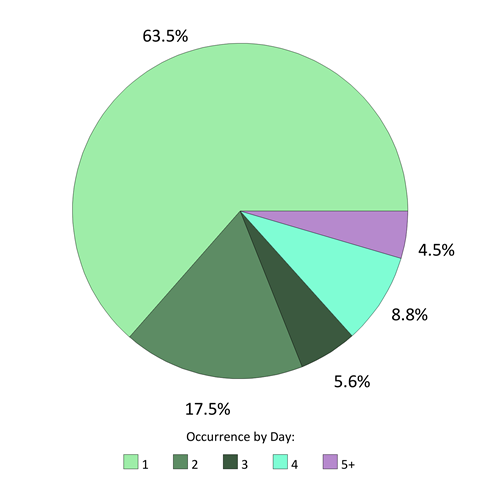
 Occurrences per day


Comments
WE ARE INTERESTED IN YOUR OPINION
Do you have any experience in this area ? We listen to you !