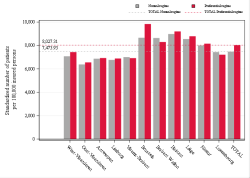
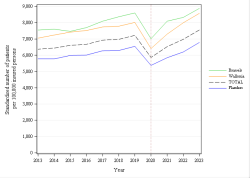
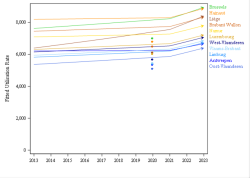
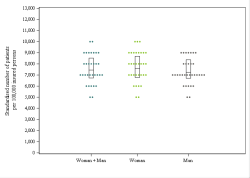
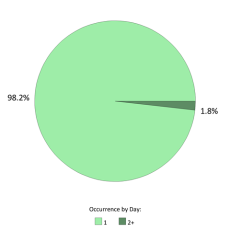
Key figures
On this table, when a statistical test has been performed, the data showing a significant difference is displayed on a yellow background, otherwise on a grey background.
The geographical dispersion marker Δ shows the result of comparing the coefficient of variation (CV) of the indicator with the median (MED) of the CVs of all analyses for this indicator: δ if CV > MED + 10%, δδ if CV > MED + 20%, δδδ if CV > MED + 30% (Exception: For median age, δ means CV > MED + 30%).
Data
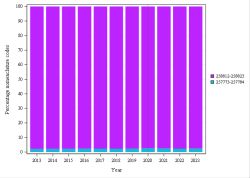
NIHDI nomenclature codes selected for analysis
| CODES | LABEL | CREATION | DELETION |
| 257773-257784 | Examen d'une lésion de l'oreille moyenne en cas de perforation du tympan, sous microscope chirurgical binoculaire du type Zeiss (en dehors des interventions chirurgicales) | 01/04/1985 | |
| 258812-258823 | Tympanoscopie uni- ou bilatérale au moyen d'un microscope binoculaire stéréoscopique à agrandissement multiple d'au moins 10 fois | 01/01/1991 |
The codes mentioned above can be used in rates and expenses, or only in expenses. We invite you to consult the full report for more information.
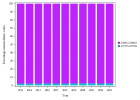
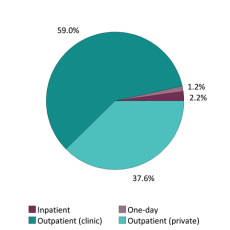
Below is a graph showing the evolution of the breakdown by volume of nomenclature codes used for the rates:
Population selection
No selection
Analysis period
2024
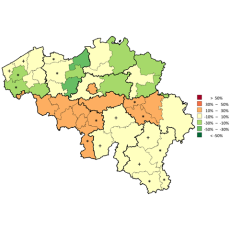
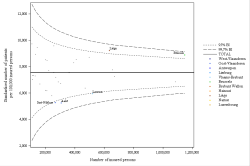
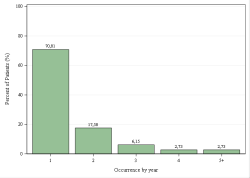
Graphics
Comments
WE ARE INTERESTED IN YOUR OPINION
Do you have any experience in this area ? We listen to you !
