Select your language

Other official information and services: www.belgium.be  belgium

Chronic diseases are, by definition, diseases that last for long periods; but beyond this observation, definitions vary widely. The Belgian Observatory of Chronic Diseases of RIZIV – INAMI (National Institute for Health and Disability Insurance) refers to a ‘condition that lasts at least six months’. Living with chronic disease often involves a feeling of upheaval in one’s life, which can affect all aspects of life and the perception of one’s own health. In general, these diseases are due to multiple causes and are difficult to cure. As a result, one of the goals of caring for these patients is to keep their health status as stable as possible. This will often require complex and multidisciplinary care.

Chronic diseases represent major healthcare costs, whether for the patient, for the health insurance system, or for society as a whole. These costs are likely to become increasingly high over time.

In this section, we will begin by describing the background of care for people living with chronic conditions by analysing the proportion of the population considered as living with chronic disease according to three criteria (CHR-1,CHR-2,CHR-3) and how these people assess their own quality of life (QoL-1).

Next, we will examine specifically the performance of the health system for people living with chronic conditions by analysing the following aspects:

  • Accessibility(A-2 and A-4) and Equity of care (EQ-4 and EQ-5) for people living with chronic condition as compared to the rest of the population;
  • Quality of care for people living with chronic conditions, i.e. the effectiveness (QE-1,QE-2,QE-10,QE-11), appropriateness (QA-1 and QA-2), continuity (QC-1, QC-3, QC-4, QC-5, QC-7) and patient-centredness (QP-1, QP-3 and QP-4) of these care;
  • Efficiency of care for people living with chronic conditions (E-5).


We have also selected 4 specific indicators of preventive care, analysed here from the viewpoint of differences between how this care is implemented for people who live with chronic disease as compared to those who do not (P-4, P-6, P-7 and P-11)


Proportion of the population considered as living with chronic disease and self-perceived quality of life of these people (CHR-1, CHR-2, CHR-3 and QOL-1)

This set of contextual indicators aims, among other things, at determining what proportion of the population has chronic disease(s) based on different data sources:

  • The proportion of individuals with the chronic illness status (RIZIV – INAMI) according to their official health expenditures (CHR-1) provides information about the financial protection measures foreseen by the Belgian healthcare system to help people with chronic disease.
  • The proportion of individuals who self-declared that they had a chronic disease in Sciensano’s national Health Interview Survey (CHR-2) gives an idea of how a representative sample of the Belgian population perceives its own health status.
  • The proportion of individuals who self-declared they had several chronic diseases over the last 12 months (CHR-3) informs about the multimorbidity of the same representative sample of the Belgian population.
  • The fourth indicator (self-perceived quality of life – QOL-1) describes health-related quality of life as perceived by the same representative sample. The goal of healthcare is indeed no longer solely to extend people’s life expectancy, but also to improve, or try to maintain, their health-related quality of life. It is therefore important to be able to measure this quality of life in an objective manner, which is possible using the EQ-5D-5L instrument, for which the KCE has recently developed a valorisation matrix based on Belgian data.
RESULTS
Table 1 - Overview of the results of the contextual indicators
Population group Score Year BE Fla Wal Bru Source UE-15
mean
CHR-1 Proportion of people with the RIZIV – INAMI chronic illness status according to their official health expenditures
NEW
In the entire population C 2018
(2020)
11.3
(12.1)
11.3
(12.1)
12.0
(12.9)
8.7
(9.4)
IMA-AIM -
In subpopulation with self-reported chronic disease 2018 31.5 32.9 29.6 31.0 HISLink
In subpopulation with self-reported multimorbidity 2018 39.2 42.0 43.5 35.6 HISLink
CHR-2 Proportion of people reporting a chronic disease
NEW
In the entire population C 2018 29.3 27.6 32.7 28.7 HIS 36.6
In subpopulation with RIZIV-INAMI chronic illness status 72.1 71.7 74.8 70.8 HISLink
CHR-3 Proportion of people reporting multimorbid state in the last 12 months
NEW
In the entire population C 2018 15.2 15.7 16.5 10.8 HIS -
In subpopulation with RIZIV-INAMI chronic illness status 47.4 48.3 48.2 38.3 HISLink
In subpopulation with self-reported chronic disease 33.8 34.4 34.1 28.7 HIS
QOL-1 Self-perceived quality of life*
NEW
In the entire population C 2018 0.843 0.868 0.798 0.839 HIS -
In subpopulation with RIZIV-INAMI chronic illness status ⚠️0.630 0.671 0.558 0.627 HISLink
In the subpopulation with self-reported chronic disease ⚠️0.696 0.739 0.632 0.687 HIS
Legend: C=contextual, ⚠️= Worse results for chronically ill persons , * calculated using EQ-5D-5L tool and scored using Belgian values set (Bouckaert et al. (2021)). See technical

People with the INAMI ‘chronic illness’ status (CHR-1):

  • The proportion of people benefiting from the RIZIV - INAMI ‘chronic illness’ status has been increasing from 8.7% in 2013 to 12.1% in 2020. This increase was similar in all three regions.
  • The proportion of people who have the RIZIV - INAMI ‘chronic illness’ status was highest in Wallonia, followed by Flanders, then Brussels. There were also major differences between provinces.
Figure 1 – Percentage of people with the ’chronic illness’ status (Belgium and regions, 2013 – 2020)

Link to technical datasheet and detailed results

People who declared that they had a chronic disease in the Health Interview Survey (CHR-2)

  • The proportion of people who declared that they had a chronic disease has been increasing from 25.1% in 2001 to 29.3% in 2018. Wallonia had the highest figure for this proportion (32.7%), followed by Brussels (28.7%) and Flanders (27.6%).
  • The proportion of the population who declared that they had a chronic disease increases (as expected) with age, changing from 14.1% (15-24 years) to 44.1% (75+ years).
  • European data (EU-SILC, European Union Statistics on Income and Living Conditions) show that the proportion of people who have chronic disease is low compared to the average of 15 European countries. In 2020, the prevalence rate was 24.8% in Belgium versus 34.1% for the EU-15 average.
  • The gap between the proportion of people who declared a chronic disease and the proportion of people who had the ‘chronic illness’ status is substantial. In 2013, this difference was 18.1% (28.6% vs 10.5%, respectively), and it remained similar in 2018, i.e. 16.6% (29.5% vs 12.9%). The main reason for this gap is that the INAMI ‘chronic illness’ status is granted to people who have high and recurrent health expenses (financial protection mechanism), not because they have a chronic disease.
Figure 2 – Percentage of people who declared that they had a chronic disease (Belgium and regions, 2001 – 2018)

Link to technical datasheet and detailed results

People who declared that they had several chronic diseases in the Health Interview Survey (CHR-3)

  • The proportion of the population who declared at least two chronic diseases has been increasing between 2001 (11.4%) and 2018 (15.2%).
  • The multimorbidity figures increase with age.
  • Wallonia showed the highest proportion and the Brussels Region had the lowest.
Figure 3 – Percentage of people who declared that they had several chronic diseases (Belgium and regions, 2001 – 2018)

Link to technical datasheet and detailed results

Comparison between CHR-1, CHR-2 and CHR-3
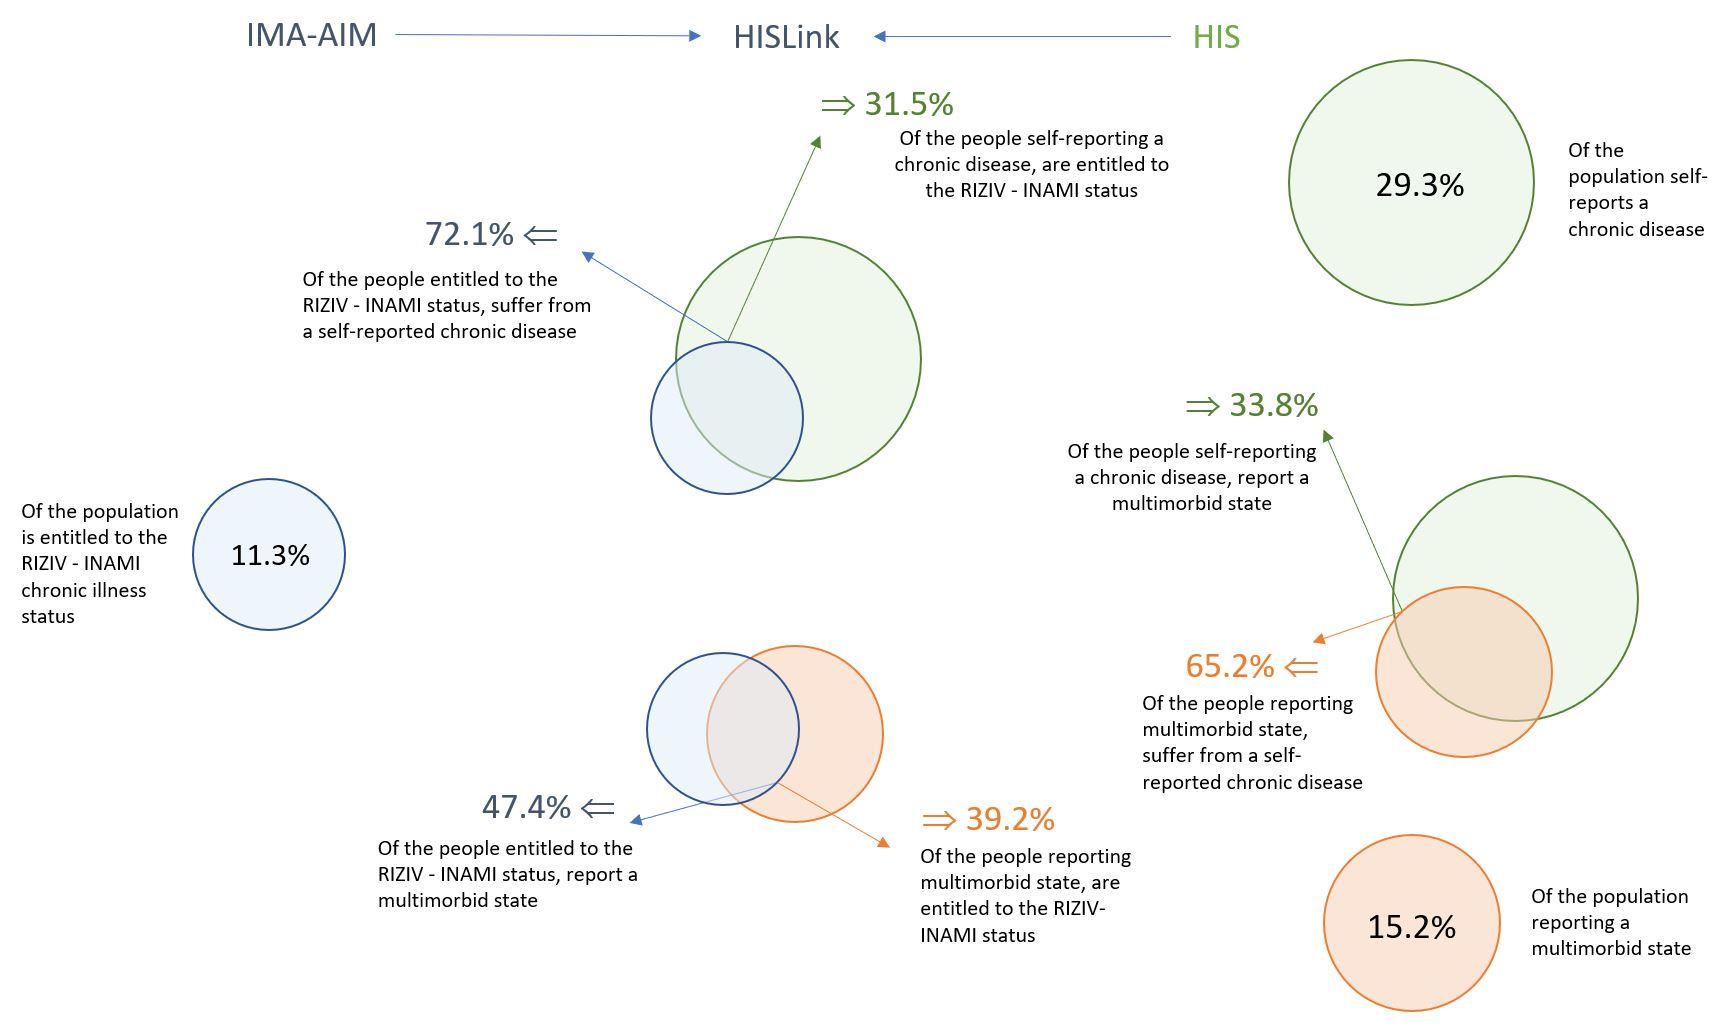
When combining the results of these three contextual indicators, certain observations emerge, which are also summarised and visualised in figure below.

  • 31.5% of the people who declared that they had a chronic disease were also beneficiaries of the ’chronic illness’ status (in 2018)
  • In 2018, 23.8% of those interviewed as part of the Health Interview Survey either had a self-declared chronic disease, or had the ‘chronic illness’ status (but not both). This implies that there is no systematic relationship between having the ‘chronic illness’ status and having a chronic disease.
  • There is no systematic relationship between having the ‘chronic illness’ status and having multimorbidity.
Figure 4 – Overlap between people who declared one (or several) chronic disease(s) and people who were entitled to the RIZIV - INAMI ‘illness condition’ status (2018) HSPA en Venn

Perceived quality of life (QOL-1)

  • In 2018, the average score of health-related quality of life was 0.843, which represents a decrease of 0.018 in health-related quality of life compared to 2013 (0.861). This decrease was observed in all regions of Belgium, but it was strongest in Wallonia.
  • People living with chronic disease (RIZIV – INAMI status or self-declared) reported a lower health-related quality of life than those with no chronic disease. This observation was more marked in Wallonia and in Brussels compared to Flanders (2013 and 2018 figures).
  • Between 2013 and 2018, the difference in health-related quality of life between those living with a self-declared chronic disease and those with no self-declared chronic disease increased in Brussels and in Wallonia, but decreased in Flanders. Looking at people who were entitled to the RIZIV - INAMI ’chronic illness’ status, the difference in quality of life between those who had that status and those who did not have it increased in Brussels, but decreased in Wallonia and in Flanders.
  • Quality of life was lower for people who had the chronic illness status compared to patients who declared that they had a chronic disease in the Health Interview Survey (2013 and 2018 figures).
  • People who had both chronic disease statuses (self-declared disease and RIZIV-INAMI chronic illness status) had a worse quality of life than those who had only one of these two statuses.

Link to technical datasheet and detailed results

Accessibility and equity of care

- Cost of health care costs not covered by the mandatory health insurance – out-of-pocket payments borne by patients (chronic A-2)

This indicator measures the share of healthcare expenditures paid out-of-pocket by households, i.e. the share of healthcare expenditures not covered by the mandatory health insurance. It is expressed as a percentage of the total healthcare expenditure.

Out-of-pocket payments include co-payments, supplements (e.g. supplementary fees of non-conventioned physicians), as well as direct payments for products and services that are not reimbursed by the mandatory health insurance (over-the-counter drugs, glasses, etc.). These costs can be a financial barrier in access to care, particularly for people with limited resources or high care needs, which is often the case for those who suffer from a chronic disease.

In order to be able to make a distinction between chronic and non chronic patients out-of-pocket payments (OOPs) were calculated at the household level using IMA-AIM data. Hence the share of OOPs in total healthcare expenditures was not calculated using data from the System of Health Accounts (SHA) as in the A2 general indicator. However, direct payments for non-reimbursed services (e.g. glasses, certain dental care, over-the-counter drugs) are not recorded in the IMA – AIM data, and information on supplements in ambulatory care is limited, leading to an underestimation of OOPs. On the other hand, reimbursements from voluntary health insurance (VHI) are not accounted for, leading to an overestimation of OOPs..

In the spirit of our universal health insurance, one would expect that the share of OOPs in the total healthcare expenditure would be lower for people suffering from a chronic condition, with the aim to reduce the financial burden for those who with high and frequent needs of care.

The general results of this indicator are discussed in the section Accessibility of care ; while here the emphasis is on the results for people living with a chronic condition.

Calculations were made based on two definitions of people living with chronic condition: persons with the RIZIV-INAMI chronic illness status (see CHR-1 indicator) and persons with a self-reported chronic condition in the EU-SILC Survey.

RESULTS
Table 2 – Results of the indicators of financial accessibility and equity, by chronic illness status and self-reported chronic condition
Statut Score BE Year Fla Wal Bru Source UE15
(mean)
A-2 Out-of-pocket payments (OOPs) as a share of total healthcare expenses* (%)
Total 17.9 2016 18.7 17.1 15.9 EU-SILC/
IMA-AIM
/
RIZIV-INAMI chronic illness status YES C 12.7 12.9 12.8 10.8
NO C 19.4 20.4 18.5 16.9
Self-reported chronic condition YES C 15.1 15.7 14.7 13.6
NO C 19.7 20.6 18.8 17.4
A4 Self-reported unmet needs for medical examination due to financial reasons (% population aged 16+)
Total red improving 2.2
(1.4)
2016
(2020)
0.8 4.0 4.9 EU-SILC/
IMA-AIM
1.7
(0.9)
RIZIV-INAMI chronic illness status YES red empty ⚠️3.9 2016 2.2 8.6 9.4 /
NO red empty 2.0 0.4 2.2 3.2
Self-reported chronic condition YES red empty ⚠️5.2 1.6 6.0 9.5
NO orange empty 1.2 0.7 3.7 4.5
EQ-4 Proportion of households with impoverishing or further impoverishing OOPs (%)
Total orange empty 1.3 2016 0.7 1.4 4.3 EU-SILC/
IMA-AIM
/
RIZIV-INAMI chronic illness status YES orange empty 1.4 0.5 1.6 5.9
NO orange empty 1.4 0.8 1.5 4.2
Self-reported chronic condition YES orange empty ⚠️1.7 1.0 1.3 6.6
NO orange empty 1.1 0.5 1.6 2.7
EQ-5 Proportion of households with catastrophic OOPs (%)
Total orange empty 2.0 1.2 2.3 5.2 EU-SILC/
IMA-AIM
/
RIZIV-INAMI chronic illness status YES orange empty ⚠️3.3 2.1 3.8 9.4
NO orange empty 1.7 1.0 1.9 4.8
Self-reported chronic condition YES orange empty ⚠️2.9 1.9 2.7 8.5
NO orange empty 1.4 0.8 2.0 3.2
Note: * indicator A-2 is calculated using EU SILC/IMA-AIM microdata and therefore differs from the results in the KCE Performance report 313 that were calculated using macro data from the System of Health Accounts (SHA).2 EU SILC/IMA-AIM microdata were used to make a distinction between persons requiring chronic care. Such subdivision is not possible in the SHA data. Unfortunately, the EU SILC/IMA-AIM microdata do not account for healthcare expenses that are not covered by the public health insurance, while such information is included in the SHA data. That is why a slightly different terminology was used in this report “share of total healthcare expenses” instead of “share of current expenditures on health”. ⚠️ = Worse results for chronically ill persons
  • The overall share of out-of-pocket payments in total healthcare expenses showed a stable trend over time. It was 17.8% in 2008, 16.9% in 2012, and 17.9% in 2016. However, The underlying composition has changed profoundly over time with a decreasing share of co-payments and an increasing share of supplements.
  • There is a lower share of OOPs in total healthcare expenses for households with a member having a chronic condition compared to households without such member:
    • According to EU-SILC (2016): 15.1% (with) versus 19.7% (without)
    • According to the chronic illness status (2016): 12.7 % (with) versus 19.4 % (without)
  • The share of out-of-pocket payments in total healthcare expenses was also lower for financially vulnerable households. One potential explanation is that financial protection measures succeed in reducing the out-of-pocket payments. An alternative explanation is that financially vulnerable households forgo or postpone care with a higher share of out-of-pocket payments, such as specialist or dental care.
    For both the distinction based on self-reported chronic diseases (EU-SILC) and the chronic illness status (IMA-AIM), the difference between households with and without a member with a chronic condition is in particular related to a lower share of co-payments for the former, which is not surprising as these households are more likely to benefit from both the MAB and increased reimbursement status, effectively lowering their co-payments. Moreover, we find that households with a member with a chronic condition have in particular a lower share of OOPs for GP, specialist and dental care.
Figure 5 – Share of co-payments, supplements and Maximum Billing reimbursements in total healthcare expenses , subdivided by chronic condition (2008, 2012, 2016) HSPA en A2 copayments

Link to technical datasheet and detailed results.

Unmet needs for medical examination due to financial reasons (A-4)

This indicator measures the proportion of individuals reporting that they had to postpone healthcare due to its cost during the past year. This indicator is derived from official surveys conducted on a national level in Belgium and internationally in Europe; these figures were reported by the surveyed individuals themselves (self-reported).

The general results of this indicator are discussed in the section Accessibility of care ; while here the emphasis is on the results for people living with a chronic condition.

Calculations were made based on two definitions of people living with chronic condition: persons with the RIZIV-INAMI chronic illness status (see CHR-1 indicator) and persons with a self-reported chronic condition in the EU-SILC Survey.

RESULTS
  • The overall incidence of persons aged 16 and over in Belgium reporting unmet needs for medical examination due to financial reasons increased from 0.5% in 2008 to 1.7% in 2012 and 2.2% in 2016. There are important differences between subgroups in the population.
  • Among individuals who report to suffer from a chronic illness, the incidence increased from 1.1% in 2008 to 3.5% in 2012 and 5.2% in 2016 compared to 0.3% in 2008, 1.1% in 2012 and 1.2% in 2016 among those without self-reported chronic condition.
  • Among persons entitled to the chronic illness, postponements of medical care is nearly twice as high in 2016 (3.9%) relative to those not entitled (2.0%) (2016 figures).

Link to technical datasheet and detailed results.

Proportion of households facing impoverishing or further impoverishing OOPs (EQ-4) and catastrophic OOPs (EQ-5)

These two indicators assess to what extent households are exposed to financial hardship; they were calculated following the methodology proposed by the World Health Organisation (WHO). This methodology assumes that households need to spend part of their resources to meet basic needs, such as food, housing and utilities. Only after meeting basic needs, resources are available to spend on healthcare. For this reason, the household’s capacity-to-pay (for healthcare) is defined as the total household financial resources minus an amount to cover basic needs, adjusted to the composition of the household. This correction is important given that low-income households devote relatively more of their resources to meeting basic needs and may face a trade-off between consuming basic needs and healthcare.

Out-of-pocket payments are labelled impoverishing when the household, although it is not poor, has out-of-pocket payments that exceed the household’s capacity-to-pay. Any OOP of a poor household is considered to deepen poverty and is defined further impoverishing. Finally, out-of-pocket payments are considered catastrophic when they exceed 40% of the household’s capacity-to-pay.

The general results of this indicator are discussed in the section Equity of care ; while here the emphasis is on the results for people living with a chronic condition.

Calculations were made based on two definitions of people living with chronic condition: persons with the RIZIV-INAMI chronic illness status (see CHR-1 indicator) and persons with a self-reported chronic condition in the EU-SILC Survey.

RESULTS

Significant differences were observed between households with and without a self-reported chronic condition:

  • Among households in which there is a member with a self-reported chronic condition, the proportion of impoverishing or further impoverishing personal contributions was higher than in households without such member (1.7% versus 1.1% in 2016).
  • The incidence of households experiencing catastrophic out-of-pocket payments is twice as high among households with a member reporting a chronic condition (2.9% versus 1.4% in 2016).

Catastrophic out-of-pocket payments were also more common among households with a member entitled to the RIZIV-INAMI chronic illness status .

Figure 6 – Proportion of households with impoverishing or further impoverishing OOPs, catastrophic OOPs and without OOPs (2008-2016), by chronic illness status and self-reported chronic condition HSPA en EQ4

Link to technical datasheet and detailed results

Quality of care – Effectiveness

Avoidable hospital admissions for asthma (QE-1), diabetes complications or uncontrolled diabetes (QE-2), and chronic obstructive pulmonary disease (COPD) (QE-10)

Asthma and diabetes are widespread chronic diseases. For both these diseases, there are effective treatments based on strong scientific evidence (evidence-based). These treatments can largely be delivered as first-line care (= by general practitioners). A well-performing first line of care should therefore help to avoid hospital admissions for asthma or diabetes complications to a large extent.
High hospitalisation rates for these two diseases can therefore be considered as indicators of poor first-line care effectiveness. They may also be seen as a sign of poor continuity of care coordination.

Hospital admissions for chronic obstructive pulmonary disease (COPD) are also used as an indicator to measure the performance of first-line care. However, in this case, it often concerns very fragile patients who require frequent hospitalisations. Therefore, what is interesting to monitor here is not so much the number of hospitalisations, but rather how this number has evolved over time.

RESULTS
Table 3 - Results of the indicators related to the effectiveness of care for chronic patients
(ID) Indicator Score BE Year Fla Wal Bru Source UE-15
(mean)
[BE]
Target
Effectiveness of primary care – avoidable hospital admissions
QE-1 Hospital admissions for asthma (per 100 000 population aged 15+) green improving! 27.9 2019 28.7 26.8 26.3 MZG-RHM
OECD
30.3*
[27.1]*
QE-2 Hospital admissions for uncontrolled diabetes or complication of diabetes (per 100 000 population aged 15+) orange improving 146.7 2019 149.9 140.3 148.1 MZG-RHM
OECD
105.2*
[134.6]*
QE-10 Hospital admissions for chronic obstructive pulmonary disease (per 100 000 population aged 15+) red deteriorating! 330.9 2019 314.7 393.8 228.3 MZG-RHM
OECD
190.4*
[278.9]*
Effectiveness of care – adhesion to a long and difficult treatment
QE-11
NEW
Successful treatment of pulmonary tuberculosis (TB) cases (% of people with pulmonary TB successfully treated) orange stable 81.2 2018 80.8 84.2 79.3 Belgian TB Register 75.5
[80.9]*
85 %
(WHO-UE, ECDC)

*Age-sex standardized rates; ! Comparison with EU-15 average should be taken with caution because differences in ICD; #All incident TB cases (not only pulmonary TB cases), §EU-7 mean, to be used with caution as it only concerns countries which have reported follow-up data for at least 80% of their respective TB cohort

  • For asthma (QE-1), the number of avoidable hospital admissions decreased from 39.2 per 100 000 population in 2009 to 36.3 per 100 000 in 2014. A change in the coding practices from 2016 (in Belgium), resulting in a shift of some mixed conditions from asthma to COPD, led to a break in data series and prevented comparison between the current data and the years before 2016. For the 2016-2019 period, a decrease can be noted in the number of avoidable hospitalisations, with rates of 32.1 per 100 000 in 2016 and 27.9 per 100 000 in 2019. Although Brussels showed a higher number of avoidable hospitalisations in 2016, the 2019 figures were similar between the three regions: 28.7 per 100 000 in Flanders, 26.8 per 100 000 in Wallonia and 26.3 per 100 000 in Brussels.
  • For diabetes (QE-2), the number of avoidable hospital admissions showed a slow decrease over the past ten years, from 185.4 per 100 000 population in 2009 to 146.7 per 100 000 population in 2019. The figures were similar between the three regions.
  • For COPD (QE-10), the hospital admission rate was quite stable over the 2009-2014 period, with 172.2 and 158.3 admissions per 100 000 population in Belgium in 2009 and 2014, respectively (see Figure 3). As with asthma, a change in coding practices in 2016 led to a break in data series and prevented further comparisons with the years before 2016. For the 2016-2019 period, an increase in hospitalisations due to COPD could be observed, except in Brussels. In 2019, the figures were 228.3 per 100 000 in Brussels, 314.7 in Flanders and 393.8 in Wallonia.
  • For asthma as for diabetes complications, a decreasing trend in avoidable hospitalisations is therefore observed over the past few years, which is a sign of improvement in the quality of first-line of care. This decrease can also be observed in other European countries. For diabetes, this decrease was, however, stronger in the European average than in Belgium. For COPD, on the other hand, an increasing trend is observed in Belgium (except in Brussels, probably due to the younger age of the population), while the trend remained stable at the European level.
  • Belgium was above the EU-15 average for diabetes and for COPD, but such type of comparison is not very informative as differences between countries can be due to other factors than quality of care. It is therefore preferable to monitor how these indicators have changed over time within a given geographic area.
  • Care trajectories (‘trajets de soins’) have been implemented in order to improve care for diabetes patients, but not for asthma patients or COPD patients. Nevertheless, conventions for the care of these patients in specialised and rehabilitation centres have been concluded.
Figure 7 – Hospitalisation rates for asthma per patient region per 100,000 population aged over 15 years (2009-2019)
Figure 8 – Hospitalisation rates for diabetes (diabetes complications) per region per 100 000 population aged over 15 years (2009-2019)

Figure 9 – Hospitalisation rates for COPD per region per 100 000 population aged over 15 years (2009-2019)

Link to technical datasheet and detailed results

- Success rates of lung tuberculosis treatment (QE-11)

This indicator allows for an assessment of tuberculosis treatment effectiveness and the degree of patient treatment adherence. In other words, this indicator reflects the ability of the Belgian healthcare system to ensure patient adherence to a long and difficult treatment that more particularly affects people in precarious situations. Belgium has a Belgian Tuberculosis Register which is maintained by the Fonds des affections respiratoires (FARES, or Respiratory Diseases Foundation), the Vlaamse vereniging voor respiratoire gezondheidzorg en tuberculosebestrijding (VRGT, or Flanders Respiratory Healthcare and AntiTuberculosis Association) and the Vlaams Agentschap Zorg en Gezondheid (Flanders Agency for Care and Health), and which offers an accurate view of the situation in our country, since this disease is subject to mandatory declaration in all three regions.

The WHO has set the target of a 85% success rate in tuberculosis treatment for the WHO European Region.

RESULTS
  • The 2019 report of the Belgian Tuberculosis Register shows that 81.2% of lung tuberculosis cases diagnosed in 2018 were successfully treated within the year. This proportion of positive outcomes represents a 3.5-point increase in percentage compared to 2017 (77.7%), but a 3-point decrease in percentage compared to 2014 (84.2%). In reality, this rate has remained fairly stable for several years across all regions.
  • When comparing the success rates of tuberculosis treatment (all sites) among 7 European countries (2018 data), Belgium showed a rate of 81.7%, ranking second in the list, immediately after the Netherlands (85.1%). However, the value of this comparison is limited as several countries only share a small part of their monitoring data.
Figure 10 – Success rates in lung TB treatment (% of successfully treated individuals), per year and per region

Figure 11 – Success rates in tuberculosis treatment in 7 European countries

Link to technical datasheet and detailed results.


Link to technical datasheet and detailed results.

Quality of care – Appropriateness

Appropriateness of follow-up for patients with diabetes (QA-1 and QA-2)

Diabetes is a chronic disease which is characterised by excessively high glucose levels in the blood. If incorrectly treated, people with diabetes are at a high risk of developing cardiovascular diseases (myocardial infarction, stroke) or kidney failure. Uncontrolled diabetes also increases the risk of visual impairment or lesions to the nerves and blood vessels which can lead to chronic wounds on the feet, or even to amputation. In Belgium, according to the figures of the Report on the health status of the population, 6.3% of the population has a known diagnosis of diabetes (Type-1 and Type-2 combined, 2018 figures). As approximately one diabetes patient in three does not know that they are affected by the disease, the true prevalence rate of diabetes can therefore be estimated to be about 10% of the population.
Monitoring a person with diabetes consists in checking their glycated haemoglobin level(HbA1c, measuring the glycaemic ‘load’ in the blood) at least twice every 15 months, their lipid profile, their albumin level (microalbuminuria or total protein measurement) and their serum creatinine level at least once every 15 months, and performing at least one eye examination by an ophthalmologist within a period of 15 months. This indicator measures the number of individuals with diabetes who have had each of these five tests done at the recommended frequencies during the last 15 months. It is calculated separately for adult diabetics (aged 18 years and over) under insulin (QA-1) and for adult diabetics (aged 50 years and over) receiving glucose-lowering drugs other than insulin (QA-2).

RESULTS
Table 4 - Results of the indicators related to the appropriateness of care for chronic patients
(ID) Indicator Score Belgium Year Flanders Wallonia Brussels
QA-1 Proportion of adult diabetics (aged 18+) under insulin with appropriate follow-up orange stable 43.2 2019 46.7 36.8 45.7
QA-2 Proportion of adult diabetics (aged 50+) receiving glucose lowering drugs other than insulin with appropriate follow-up orange stable 15.9 2019 16.4 13.4 22.9
Source: IMA-AIM, no available mean data for UE-15.
  • In 2019, among the adult diabetics (18+) under insulin, 43.2% had done all of the 5 tests selected for assessing the quality of diabetes follow-up during the last 15 months, which represents an improvement compared to 2009 (36.3%).
  • In adult diabetics (50+) receiving glucose-lowering drugs other than insulin, the coverage of all 5 tests combined is much lower, i.e. 15.9%, which, however, also represents an improvement compared to 2009 (9.1%).
  • Only few differences between regions were observed, but for adult diabetics under insulin, the results were slightly lower in Wallonia. For adult diabetics receiving glucose-lowering drugs other than insulin, Brussels showed the best results.
  • The low rates for these five tests combined may be partly explained by the fact that some recent guidelines do not recommend these five tests for all diabetes patients. For example, some measures are only recommended for diabetes durations above 5 years (for Type-1 diabetes), and visits to the ophthalmologist could be considered every 2 years for some patients. It is therefore important to also look at the detailed results per test.
  • For adult diabetics under insulin, serum creatinine (97.4%) measurements, cholesterol measurements (92.4%) and glycated haemoglobin measurements (84.1%) were very well covered. Annual visits to the ophtalmologist (66.7%) and albumin level measurements (microalbuminuria (62.5%) or proteinuria (31.2%)) were less well observed, but as indicated above, they are not systematically recommended for certain patients.
  • For adult diabetics (50+) receiving glucose-lowering drugs other than insulin, the serum creatinine (94.9%) and cholesterol (90.1%) measurements were well covered, the glycated haemoglobin measurements were less frequent (twice per 15-months for only 66.2% patients), and the albumin measurement and visit to the ophtalmologist during the 15-month period were done for less than half of the patients. Further analysis would be necessary in order to determine the reason for these low rates, particularly regarding the consultation by an ophthalmologist: can these low results be partly explained by new clinical guidelines, or do they reflect possible issues of coordination (among doctors) or accessibility of care (e.g. long waiting times)?
Figure 12 – Proportion of diabetic patients getting the combination of the five tests over 15 months, details per region and per year (2009-2019)
Figure 13 – Proportion of diabetic patients getting the combination of five tests over 15 months, details per test in 2019 in Belgium

Link to technical datasheet and detailed results

Quality of care – Continuity

- Proportion of the population who have an Global Medical Record (GMR) (QC-1)

Since 2001, in Belgium, each person can request a general practitioner to create an Global Medical Record (GMR) for them, where all their medical information can be centralised and managed. This allows the physician to have a better overview about everything that affects the person’s health, their medical history, treatments, allergies, vaccinations, hospitalisations, etc. Each examination or visit made with another healthcare provider is also recorded, which avoids unnecessary examinations and promotes communication between the different caregivers. An GMR is therefore a guarantee of optimal health management for every person.

Since 2016, GMRs have become electronic: they are now named electronic Global Medical Record (eGMR), and general practitioners have an obligation to acquire approved software in order to be able to manage these computerised medical records by 2020 at the latest. This indicator measures the proportion of the population who have an Gobal Medical Record (whether computerised or not).

This indicator is discussed in the section titled Quality of care/ Continuity for the whole population; it is analysed here with a specific emphasis on people living with chronic condition.

RESULTS
Table 5 - Indicators on continuity of care, by chronic illness status
(ID) Indicator Status Score BE Fla Wal Bru
Informational continuity in general practice
QC-1 Coverage of global medical record (% of persons who have a global medical record (GMR) with a general practitioner) Total green stable 77.9 83.9 72.6 60.8
RIZIV-INAMI chronic illness status orange stable 88.3 92.5 83.5 75.7
No chronic illness status NA 77.3 83.3 71.8 60.0
Informational continuity in medication
QC-7
NEW
Proportion of individuals with a reference pharmacist (%) Total NA 7.3 8.9 5.6 4.1
RIZIV-INAMI chronic illness status red improving 28.5 33.6 21.4 20.8
No chronic illness status NA 4.6 5.6 3.3 2.5
Management continuity between hospital and GP
QC-3 Management continuity between hospital and GP Total orange deteriorating 53.2 54.2 53.2 42.9
RIZIV-INAMI chronic illness status orange deteriorating 58.1 59.4 57.8 46.5
No chronic illness status red deteriorating 46.9 47.7 47.0 38.3
Year: 2019, source: AIM, no available mean data for UE-15.
Table 6 - Indicators on continuity of care for chronic patients
(ID) Indicator Score BE Fla Wal Bru
Coordination in ambulatory care for chronic patients
QC-4 Proportion of adult diabetics under insulin (aged 18+) within a pass/pre-care trajectory, a care trajectory, or a convention (%) green stable 91.0 92.6 89.6 86.8
QC-5 Proportion of adult diabetics receiving other glucose-lowering drugs than insulin (aged 50+) within a pass/pre-care trajectory, a care trajectory, or a convention (%) red improving 26.2 32.9 16.9 23.0
Year: 2019, source: AIM, no available mean data for UE-15.
  • The percentage of the population who have an GMR has been increasing over the years. It has changed from 60.1% in 2014 to 77.9% in 2019. The increase in this coverage was, however, lower for patients with the chronic illness status (+12.6 percentage points) compared to other patients (+18.2 percentage points).
  • The proportion of GMRs was higher among patients who had the chronic illess status (2019: 88.3%) than among patients who were not entitled to it (2019: 77.3%), except for the elderly and those aged 24-44 years.
  • Differences were observed between regions (Flanders had better coverage than the other regions), but they have tended to diminish over time. The same observation was made between chronic and non-chronic patients.
Figure 14 – Change in the number of insured people who have an Global Medical Record (GMR) per region, per year (2014-2019) and per ’chronic condition’ status
GMR CHART

Link to technical datasheet and detailed results

- Proportion of patients who have a referring pharmacist (QC-7)

As of 1st October 2017, RIZIV¬–INAMI has introduced a ‘referring pharmacist’ service for people with a chronic condition who use a public pharmacy (therefore, this does not relate to people who live in residential care or nursing homes). This service consists in recording all delivered medicines in a (electronic) pharmacy file, providing the patient with a medication scheme, and making this scheme available to other care providers.
This indicator assesses membership to this service among patients who have the ‘chronic condition’ status, compared to those who do not have this status.
A survey conducted in 2020 by the Observatory of Chronic Diseases on a sample of patients who had a referring pharmacist showed that:

  • 80% received a clear explanation of the service at the time of their request,
  • 51% received a medication scheme; among these, 84% considered that this did not change their use of medicines
  • 33% were aware that their general practitioner was informed that they had a referring pharmacist,
  • 66% believed there was good communication among all their caregivers regarding the management of their medicines.
RESULTS
  • Membership rates have been increasing, as 29% of people with the chronic illess status had a referring pharmacist by the end of 2019 (including 57% women)
  • This proportion was highest for Flanders and lowest for Wallonia.
Figure 15 – Proportion of people with the chronic illness status who have a referring pharmacist, per region (2017-2019)

Link to technical datasheet and detailed results.

Proportion of hospital stays patients of elderly patients (65+) with a follow-up GP consultation within 1 week upon hospital discharge (QC-3)

This indicator measures the proportion of hospital discharges of elderly patients (aged 65+ years) that were followed by a contact with a general practitioner within one week. The indicator allows to assess the management continuity between hospital and general practice (primary health care).

Returning to one’s regular living environment after the end of a hospital stay is often a critical moment for elderly people. It is not only about leaving the hospital, but also (re-)organising, without discontinuation, the care and emotional support system that will help them resume the normal course of their lives. For this reason, it is recommended that each elderly person leaving hospital visits a/their general practitioner after approximately one week to check if the arrangements made at discharge are (still) appropriate. This helps reduce the risk of adverse events, the number of readmissions to hospital and the duration of hospital stays.

This indicator is all the more important as the number of elderly patients has been increasing, while the average duration of hospital stays has been decreasing. In the past few years, many initiatives (e.g. integrated care pathways) have been implemented in order to reinforce continuity of care.

The general results of this indicator are discussed in the section Quality of care/ Continuity; while here the emphasis is on the results for people living with a chronic condition.

RESULTS
  • Despite the supposed advantage of having a GP encounter within the week after hospital discharge, the follow-up rate declined over time from 60.7% in 2013 to 53.2% in 2019. (from 65.2% in 2013 to 58.1% in the group with the RIZIV-INAMI chronic illness status and from 55.9% in 2013 to 46.9% in 2019 in the group without the status). The decline can indicate a reduction in early follow-up or a switch to follow-up by other healthcare providers.
  • There is important variation in the follow-up rate. The analysis suggest that, despite the overall downward trend, follow-up was more targeted is being targeted to those with the highest need , such as people with the chronic illness status: 58.1% versus 46.9% among those who did not have this status (2019).
  • The follow-up rate was lower in Brussels compared to Flanders and Wallonia for the whole population.
Figure 16 – Evolution in proportion of hospital stays of elderly patients (65+) followed by a GP consultation within 1 week after discharge, by chronic illness status and by year (2013-2019)

Link to technical datasheet and detailed results

- Proportion of diabetics who are registered in a care model for diabetes (QC-4 and QC-5)

RIZIV–INAMI has introduced various care models intended to optimise care for patients with diabetes: care trajectories (‘trajets de soins-zorgtrajecten’), conventions for their care in specialized centre, and pre-trajectories (‘pré-trajets diabète – pre-trajecten’) for patients with Type-2 diabetes (replacing the ‘Diabetes passports’ (‘Passeports pour le diabete - diabetespaspoort’) since 2016).

The purpose of these various care models is to better inform patients and their close relatives about diabetes treatment, management of complications, etc., to encourage their involvement in the patient’s care, and to support good communication between the patient and the different care providers. This last point can serve as an indicator for continuity of care.

Depending on the care model, patients can for example receive better reimbursements for visits to their general practitioner and diabetologist, reimbursement for their blood glucose self-monitoring equipment, and visits with nurses specialised in diabetes management, dieticians, podologists, etc.

We have calculated two indicators in this population to measure continuity of care coordination:

  • proportion of individuals with diabetes (aged over 18 years) under insulin who are registered in a supported care path, a programme within an approved specialised facility for diabetes self-management, a pre-treatment supported care path, or who have a diabetes passport (QC-4).
  • proportion of adult individuals with diabetes (aged over 50 years) receiving other glucose-lowering drugs than insulin, who are incorporated into a supported care path, a programme within an approved specialised facility for diabetes self-management, a pre-treatment supported care path, or who have a diabetes passport (QC-5).
RESULTS
  • The proportion of diabetic adults under insulin who were included in at least one diabetes care model (a pass/pre-care trajectory, a care trajectory or a convention) was relatively high (91.0%). A majority (82.7%) had opted for an approved agreement, but a relative increase in care paths was observed. The overall trend has been stable since 2014.
  • By contrast, among diabetic adults receiving other glucose-lowering drugs than insulin, only 26.2% were included in a diabetes care model, including a little over half in a care trajectory and the other half in a pass/pre-care trajectory. A positive trend appeared nevertheless, particularly for care trajectories.
  • Adult diabetics under insulin with a low socio-economic level (beneficiaries of the increased reimbursement status [BIM or ‘bénéficiaire de l'intervention majorée – met een verhoogde tegemoetkoming’]) were registered slightly less often in one of these care models. Conversely, adult diabetics receiving other glucose-lowering drugs than insulin and with a low socio-economic level were registered slightly more often.
  • The proportion of patients who had at least one registration in a diabetes care model was similar among regions for patients under insulin. For patients receiving other glucose-lowering drugs than insulin, this proportion was higher in Flanders (32.9%) compared to the two other regions (16.9% for Wallonia and 23.0% for Brussels).
Figure 17 – Evolution in the proportion of patients in a diabetes care model, per care model (2014-2019))

Figure 18 – Proportion of patients registered in a diabetes care model, per region (2006-2016)

Link to technical datasheet and detailed results

Quality of care – Patient-centred care

- Patient experiences with the physician (QP-1, QP-3, QP-4)

Patient centred care is an approach toward healthcare that is voluntarily focused on the patient’s needs, respecting his/her individual preferences and ensuring that his/her values guide the clinical decision-making process. An assessment of patient-centricity typically relates to recognition of the patient’s needs, wishes and preferences, the quality of communication with the healthcare provider, and the level of involvement of the patient and their relatives in their care. This patient centred approach improves patient experiences and helps avoid issues related to care fragmentation, e.g. contradictory medical opinions, over-medication, over-hospitalisation and unresponsiveness.
Since 2011, the OECD has been collecting questions on how patients perceive the quality of a consultation for its ‘Health at a Glance’ report. Sciensano has included some of these questions in the questionnaire of its national Health Interview Survey (HIS); the responses to three of these questions have been used here as indicators:
Question: The last time you visited a physician (a general practitioner or a specialist),

  • Did this doctor spend enough time with you? (QP-1)
  • Did this doctor give you an opportunity to ask questions or raise concerns about recommended treatment? (QP-3)
  • Did this doctor involve you as much as you wanted to be in the decisions about your care and treatment? (QP-4)

These indicators are discussed overall in the section titled Quality of care/ Patient-centricity for the whole population; they are analysed here with a specific emphasis on people living with chronic conditions.
Calculations were made based on two definitions of people living with chronic condition: those who had the RIZIV-INAMI chronic illness status and those who self-declared a chronic disease in the Health Interview Survey (HIS – see CHR-1 and 2 indicators)

RESULTS
Table 7 - Results of the indicators related to the patient-centeredness of care, chronic versus non-chronic indicators
Statut Score BE Fla Wal Bru UE-15
(mean)
QP-1 Physician spending enough time with patients during the consultation (% of respondents, contact with GP/SP)
Total green stable 97.5 97.8 97.2 95.9 81.7
RIZIV-INAMI chronic illness status Yes green stable 97.6 98.3 96.7 96.7 -
No green stable 97.4 97.7 97.2 95.9
Self-reported chronic disease Yes green stable 97.4 98.0 96.9 96.5
No green stable 97.6 98.0 97.4 95.4
Chronic illness status & Self-reported chronic disease Yes green stable 98.2 98.6 98.3 95.6
QP-3 Physician giving opportunity to ask questions or raise concerns (% of respondents, contact with GP/SP)
Total green stable 97.5 98.0 97.0 95.9 -
RIZIV-INAMI chronic illness status Yes green stable 96.6 98.3 96.6 96.7 -
No green stable 97.7 98.1 97.2 96.0
Self-reported chronic disease Yes green stable 97.1 97.8 96.6 94.3
No green stable 97.7 98.0 97.5 96.2
Chronic illness status & Self-reported chronic disease Yes green stable 97.3 97.5 97.8 94.4
QP-4 Physician involving patients in decisions about care and/or treatments (% of respondents, contact with GP/SP)
Total green stable 95.4 96.0 94.8 93.8 82.8**
RIZIV-INAMI chronic illness status Yes green stable 95.8 96.9 94.6 93.5 -
No green stable 95.4 95.8 94.8 94.1
Self-reported chronic disease Yes green stable 94.3 95.1 93.6 91.8
No green stable 96.1 96.6 95.8 94.1
Chronic illness status & Self-reported chronic disease Yes green stable 96.2 97.3 95.6 91.4
Year: 2018, source: HISLink
  • Positive patient experiences were high for all three questions, regardless of age, region, and chronic disease status (QP-1).
  • Positive patient experiences regarding the chance to ask questions or share concerns about the treatment (QP-3) were very high and did not vary according to chronic disease status (RIZIV-INAMI or HIS). They remained stable over time and were similar across the different regions.
  • The question regarding involvement in the decision about the patient’s care (QP-4) obtained slightly lower results compared to the two other questions. Patients reported slightly more positive experiences in Flanders compared to Wallonia and Brussels. There did not seem to be any apparent difference according to chronic disease status (RIZIV-INAMI or self-declared), even though Walloon patients who combined both these statuses reported less positive experiences (91.4%) than those who had no chronic disease or who had only one type of chronic disease status.
  • Overall, patients with both statuses (RIZIV-INAMI and self-declared) reported positive experiences more often than those who had only one type of chronic disease status.
  • Comparing with other countries, Belgium ranked first for positive patient experiences regarding the time spent by their doctor during the visit, and came second for patients’ perceived involvement in the decision about their care or treatment. There is, however, no analysis that distinguishes chronic disease patients from other patients.
Figure 19 – Proportion of people (aged 15 years and over) reporting a positive experience regarding the time spent by the doctor with them during a visit, with or without chronic illness status (RIZIV-INAMI), and by region (QP-1)

Link to technical datasheet and detailed results

Efficiency

- Proportion of ‘low-care’ renal dialyses (E-5)

Haemodialysis, a prime example of chronic treatment, is very costly when performed in a hospital setting, but there are less expensive (low-care) alternatives such as peritoneal dialysis or haemodialysis at an ancillary facility or at home. These alternatives can be suitable for many patients with renal impairment. They also offer more flexible schedules than dialysis in the hospital setting. In 2018, all general hospitals who had signed the dialysis financing agreement were asked to achieve at least 40% of low-care dialyses.
This indicator provides information about the proportion of low-care dialyses performed by Belgian hospital teams.

RESULTS
Table 8 - Results of the indicators of efficiency of the healthcare system
(ID) Indicator Score Belgium Flanders Wallonia Brussels
E-5
NEW
Proportion of low-care dialysis (%) orange improving 43.0 44.3 41.0 43.2
Year: 2020, source: RIZIV-INAMI, No available mean data for UE-15.
  • Since 2018, 52 hospitals have signed the INAMI – RIZIV agreement establishing a target of at least 40% of low-care dialyses.
  • The proportion of 40% low care dialyses has been achieved at the national level (43.0%) and for all three regions (43.2% in Brussels, 41.0% in Flanders and 44.3% in Wallonia) (2020).
  • However, at the level of individual hospitals, the 40% target was only reached by 45 hospitals out of 52 (86.5%), including 8 out of 9 in Brussels, 18 out of 24 in Flanders and 19 out of 19 in Wallonia. These included 28 general hospitals (out of 33), 11 non-university hospitals of university type (out of 12) and 6 university hospitals (out of 7).

Link to technical datasheet and detailed results

Preventive Care

- Influenza vaccination among the elderly (P-4)

Vaccination against seasonal influenza is considered as the most efficient preventive measure to reduce the frequency and severity of influenza virus infections. In Belgium, this vaccination is currently recommended (among others) for all elderly people aged 65 years and over, and for all people living in nursing homes.

The WHO recommends a target vaccination rate of 75% for elderly people.

The proportion of elderly people (aged 65+ years) who were vaccinated against influenza during the past year is an important indicator for assessing preventive care accessibility. This indicator is calculated based on RIZIV-INAMI data regarding reimbursement of the vaccine.

This indicator is essentially discussed in the section titled Preventive care; it is analysed here with a specific emphasis on people living with chronic conditions.

RESULTS
Table 9 – Resultsfor preventive care indicators according to chronic illness status
Status Score BE Fla Wal Bru Source EU-15
(mean)
Target
P-4 Influenza vaccination (% of population aged 65+)
Total red stable 55,1 60,8 46,1 44,7 IMA-AIM ; OECD 53,7 75% (WHO)
Chronic illness status orange improving 72,3 77,7 64,3 63,6
Not chronic illness status red stable 48,1 54,2 38,0 37,0
P-6 Breast cancer screening (% women aged 50-69 years), organised screening
Total red stable 33,2 50,2 4,7 10,4 IMA-AIM - -
Chronic illness status red stable 28,2 45,6 4,7 12,0
Not chronic illness status red stable 33,0 50,9 4,7 10,0
P-7 Breast cancer screening (% women aged 50-69 years), all mammograms
Total red stable 59,7 65,3 51,5 51,0 IMA-AIM 73,5 75% (EU)
Chronic illness status red stable 58,8 63,0 53,2 55,5
Not chronic illness status red stable 59,9 65,7 51,1 50,0
P-11 Regular contacts with dentist (% pop aged 3+)
Total orange improving 55,3 60,0 51,0 50,1 IMA-AIM -
Chronic illness status orange improving 53,1 54,7 49,7 56,5
Not chronic illness status orange improving 55,6 60,7 51,2 49,3
Year: 2019
  • In 2019, the influenza vaccination coverage for people aged 65 years and over (not living in a nursing home) was 55.1%, much lower than the WHO target of 75%, and has remained stable since 2013 (56.4).
  • Nevertheless, the influenza vaccination coverage was higher in Belgium than the average of EU-15 countries (53.7% in 2018).
  • Some disparity among regions was observed, with 60.8% in Flanders, 46.1% in Wallonia and 44.7% in Brussels.
  • In 2019, the vaccination rate was higher in patients with the ’chronic illness’ status (72.3%) than in those without this status (48.1%). This difference (24.2%) was regardless of patient socio-economic characteristics; it has been widening since 2013 (22.5%).
  • Patients with the chronic illness status were more often vaccinated against influenza in Flanders (77.7%) compared to Brussels (63.6%) or Wallonia (64.3%). The distribution was similar for non-chronic disease patients.
  • The vaccination coverage for people aged 85 years and over was overall higher than for the other age groups.
  • In nursing homes (in the Wallonia-Brussels Federation), residents with the chronic illness status were more often vaccinated (84.2%) than residents without the chronic illness status (73.9%).
Figure 20 – Vaccination coverage for influenza in patients aged 65+, per region (2013-2019) and per chronic illness status: chronic (left) or non-chronic (right)

Link to technical datasheet and detailed results

Breast cancer screening (P-6 and P-7)

Since the beginning of the 2000s, there has been a national breast cancer screening programme in Belgium for women aged 50 to 69 years. In this age group, each woman receives, every 2 years, an invitation to participate in this programme in an approved radiology/senology department, free of charge. The mammography exams performed as part of this programme follow a standardised procedure defined by European quality standards. The age group of 50 to 69 years was set because this is the age when early breast cancer screening is most likely to lead to a healthy outcome. This organised screening programme is under the responsibility of the Regions, but mammography exams are reimbursed by RIZIV-INAMI.

In addition, women may also choose to have their screening done outside of the organised programme; in that case, they will use the option of a diagnosis for screening purposes. This type of ‘screening’ (called ‘opportunistic’) generally consists in a clinical examination by a specialist, a mammogram, and often an ultrasound exam. This more expensive examination is not done on an invitation, but at the individual’s own initiative. There is no evidence to demonstrate that it is more efficient than organised screening, particularly since it is not standardised and not subject to quality controls. It is reimbursed by RIZIV-INAMI as a diagnostic test.

Two indicators help measure the level of attendance to breast cancer screening exams:

  • Proportion of women aged 50 to 69 years who have had a mammography exam in the last two years as part of the organised screening programme (P-7).
  • Proportion of women aged 50 to 69 years who have had a mammography exam in the last two years regardless, whether or not as part of the organised screening programme (P-6).

It is interesting to consider these two indicators together, as the first provides a measurement of attendance to the organised screening programme , and the second measures the total coverage of women (in the recommended age group). It is generally considered that an overall coverage of 75% is the threshold for this examination to reach acceptable cost efficiency. Belgium did not achieve this target, whereas France, Italy, the Netherlands, Luxembourg, Portugal and Sweden did in 2019.

These two indicators are essentially discussed in the section titled Preventive care; they are analysed here with a specific emphasis on people living with chronic conditions.

RESULTS
  • The total coverage of women (organised screening + opportunistic mammography exams) reached 59.7% in 2019. After an improvement in the early 2000s (43% in 2003), this coverage has been slightly decreasing since 2016 (62%).
  • The highest rate was in Flanders (65.3%), compared to Wallonia (51.5%) and Brussels (51.0%) (2019 figures).
  • Women with the chronic illness status had less (organised) screening mammograms than women without this status. However, this result varied according to age group, BIM [increased reimbursement] status, and region.
  • Younger women (aged 50-59 years) with the chronic illness status were more frequently covered by breast cancer screening (total mammograms) than women of the same age without any chronic disease.
  • In Wallonia and in Brussels, women with the chronic illness status were more likely to have mammograms, regardless of their age group, whereas in Flanders the situation was reversed: women with the chronic illness status were less likely to have mammograms than those without this status.
Figure 21 – Breast cancer screening (all mammograms) in women aged 50-69 years, per region and per status: non-chronic (left) or chronic (right)

Link to technical datasheet and detailed results

- Oral health: Proportion of the population having regular contacts with a dentist (P-11)

Oral and dental health is important for health in general, since bad teeth can promote the development of diseases (including cardiovascular diseases). Regular visits to the dentist’s help diagnose and treat dental problems before they become too serious, but also prevent them, either by making people aware of preventive behaviours (e.g. proper tooth brushing), or by performing prophylactic procedures (e.g. tartar removal, application of fluoride treatments).

In addition, it is known that socio-economically disadvantaged people have less access to oral and dental healthcare and are not sufficiently informed about the importance of preventive behaviours in this area.

This indicator measures the proportion of the population (aged over 3 years) who have regular contacts with a dentist; it is therefore a good reflection of Accessibility of preventive care.

This indicator is essentially discussed in the section titled Preventive care; it is analysed here with a specific emphasis on people living with chronic disease.

RESULTS
  • The population that regularly visits the dentist has been increasing between 2014 and 2019, including for people with the ‘chronic illness status’ (+9.7 percentage points with the status, versus +5.5 percentage points without the status).
  • The highest regular attendance rate was observed among children and adolescents (aged 5-17 years). This result can be partially explained by the fact that there is no co-payment for children’s dental care.
  • The regular dental attendance rate was higher among people with the ‘chronic illness status’ than among others, in all age categories, except for those aged 75+ years. Therefore, the overall lower rate seen among people with the ’chronic illness status’ was mainly due to the elderly population, which represents a significant fraction of people with the ’chronic illness status’.
  • Regular visits to the dentist were more common in Flanders (60.0%) than in Wallonia (51.0%) and in Brussels (50.1%) (2019 figures). These differences, however, became smaller when analysing the figures according to ’chronic illness status’ (56.5% in Brussels, 54.7% in Flanders and 49.7% in Wallonia for people with the ‘chronic illness status’).
Figure 22 – Regular contacts with a dentist, with or without ’chronic illness status’ and per region (2014-2019)

Link to technical datasheet and detailed results