Key figures
On this table, when a statistical test has been performed, the data showing a significant difference is displayed on a yellow background, otherwise on a grey background.
The geographical dispersion marker Δ shows the result of comparing the coefficient of variation (CV) of the indicator with the median (MED) of the CVs of all analyses for this indicator: δ if CV > MED + 10%, δδ if CV > MED + 20%, δδδ if CV > MED + 30% (Exception: For median age, δ means CV > MED + 30%).
Data
NIHDI nomenclature codes selected for analysis
| CODES | LABEL | CREATION | DELETION |
| 301490- | A partir du 18e anniversaire, le droit à l'intervention de l'assurance pour les prestations 302153-302164, 302175-302186, 302190-302201, 302212-302223, 302234-302245, 302551-302562, 302573-302584, 302595-302606, 302610-302621, 302632-302643 est conditionné, pour le bénéficiaire, par le recours, au cours de l'année civile précédant celle pendant laquelle la prestation est effectuée, soit à une consultation effectuée par un praticien de l'art dentaire ou à une prestation dentaire visée par le présent ar | 01-10-2022 | |
| 301593-301604 | * Examen buccal y compris l’établissement d’un plan de traitement, l’enregistrement des données pour l’établissement ou la mise à jour du dossier dentaire et la motivation du patient concernant les soins préventifs et curatifs à effectuer, une fois par année civile, à partir du 19ème anniversaire | 01-05-2000 | |
| 301696-301700 | ** Nettoyage prophylactique, par quadrant, par trimestre, chez des handicapés, physiques ou mentaux, à partir du 19e anniversaire, qui ne sont pas en état d'acquérir ou de conserver une hygiène buccale quotidienne normale pour leur âge sans l'aide d'une tierce personne : quadrant supérieur droit | 01-06-1998 | |
| 301711-301722 | ** Nettoyage prophylactique, par quadrant, par trimestre, chez des handicapés, physiques ou mentaux, à partir du 19e anniversaire, qui ne sont pas en état d'acquérir ou de conserver une hygiène buccale quotidienne normale pour leur âge sans l'aide d'une tierce personne : quadrant supérieur gauche | 01-06-1998 | |
| 301733-301744 | ** Nettoyage prophylactique, par quadrant, par trimestre, chez des handicapés, physiques ou mentaux, à partir du 19e anniversaire, qui ne sont pas en état d'acquérir ou de conserver une hygiène buccale quotidienne normale pour leur âge sans l'aide d'une tierce personne : quadrant inférieur gauche | 01-06-1998 | |
| 301755-301766 | ** Nettoyage prophylactique, par quadrant, par trimestre, chez des handicapés, physiques ou mentaux, à partir du 19e anniversaire, qui ne sont pas en état d'acquérir ou de conserver une hygiène buccale quotidienne normale pour leur âge sans l'aide d'une tierce personne : quadrant inférieur droit | 01-06-1998 | |
| 301770-301781 | ** Nettoyage prophylactique, par quadrant, par trimestre, chez des handicapés, physiques ou mentaux, à partir du 19e anniversaire, qui ne sont pas en état d'acquérir ou de conserver une hygiène buccale quotidienne normale pour leur âge sans l'aide d'une tierce personne : plusieurs quadrants (3 dents et/ou implants minimum pour l'ensemble des quadrants incomplets) | 01-06-1998 | |
| 301976- | A partir du 18e anniversaire, le droit à l'intervention de l'assurance pour les prestations 302153-302164, 302175-302186, 302190-302201, 302212-302223, 302234-302245, 302551-302562, 302573-302584, 302595-302606, 302610-302621, 302632-302643 est conditionné, pour le bénéficiaire, par le recours, au cours de l'année civile précédant celle pendant laquelle la prestation est effectuée, soit à une consultation effectuée par un praticien de l'art dentaire ou à une prestation dentaire visée par le présent ar | 01-01-2002 | |
| 302153-302164 | * Détartrage, par quadrant, par année civile, à partir du 19e anniversaire : quadrant supérieur droit | 01-01-1989 | |
| 302175-302186 | * Détartrage, par quadrant, par année civile, à partir du 19e anniversaire : quadrant supérieur gauche | 01-01-1989 | |
| 302190-302201 | * Détartrage, par quadrant, par année civile, à partir du 19e anniversaire : quadrant inférieur gauche | 01-01-1989 | |
| 302212-302223 | * Détartrage, par quadrant, par année civile, à partir du 19e anniversaire : quadrant inférieur droit | 01-01-1989 | |
| 302234-302245 | * Détartrage, par quadrant, par année civile, à partir du 19e anniversaire : plusieurs quadrants (3 dents et/ou implants minimum pour l'ensemble des quadrants incomplets) | 01-01-1991 | |
| 302352-302363 | ** Nettoyage prophylactique effectué par un hygiéniste bucco-dentaire, par quadrant, par trimestre, chez des handicapés, physiques ou mentaux, à partir du 19e anniversaire, qui ne sont pas en état d'acquérir ou de conserver une hygiène buccale quotidienne normale pour leur âge sans l'aide d'une tierce personne : quadrant supérieur droit | 01-10-2022 | |
| 302374-302385 | ** Nettoyage prophylactique effectué par un hygiéniste bucco-dentaire, par quadrant, par trimestre, chez des handicapés, physiques ou mentaux, à partir du 19e anniversaire, qui ne sont pas en état d'acquérir ou de conserver une hygiène buccale quotidienne normale pour leur âge sans l'aide d'une tierce personne : quadrant supérieur gauche | 01-10-2022 | |
| 302396-302400 | ** Nettoyage prophylactique effectué par un hygiéniste bucco-dentaire, par quadrant, par trimestre, chez des handicapés, physiques ou mentaux, à partir du 19e anniversaire, qui ne sont pas en état d'acquérir ou de conserver une hygiène buccale quotidienne normale pour leur âge sans l'aide d'une tierce personne : quadrant inférieur gauche | 01-10-2022 | |
| 302411-302422 | ** Nettoyage prophylactique effectué par un hygiéniste bucco-dentaire, par quadrant, par trimestre, chez des handicapés, physiques ou mentaux, à partir du 19e anniversaire, qui ne sont pas en état d'acquérir ou de conserver une hygiène buccale quotidienne normale pour leur âge sans l'aide d'une tierce personne : quadrant inférieur droit | 01-10-2022 | |
| 302433-302444 | ** Nettoyage prophylactique effectué par un hygiéniste bucco-dentaire, par quadrant, par trimestre, chez des handicapés, physiques ou mentaux, à partir du 19e anniversaire, qui ne sont pas en état d'acquérir ou de conserver une hygiène buccale quotidienne normale pour leur âge sans l'aide d'une tierce personne : plusieurs quadrants (3 dents et/ou implants minimum pour l'ensemble des quadrants incomplets) | 01-10-2022 | |
| 302551-302562 | * Détartrage effectué par un hygiéniste bucco-dentaire, par quadrant, par année civile, à partir du 19e anniversaire : quadrant supérieur droit | 01-10-2022 | |
| 302573-302584 | * Détartrage effectué par un hygiéniste bucco-dentaire, par quadrant, par année civile, à partir du 19e anniversaire : quadrant supérieur gauche | 01-10-2022 | |
| 302595-302606 | * Détartrage effectué par un hygiéniste bucco-dentaire, par quadrant, par année civile, à partir du 19e anniversaire : quadrant inférieur gauche | 01-10-2022 | |
| 302610-302621 | * Détartrage effectué par un hygiéniste bucco-dentaire, par quadrant, par année civile, à partir du 19e anniversaire : quadrant inférieur droit | 01-10-2022 | |
| 302632-302643 | * Détartrage effectué par un hygiéniste bucco-dentaire, par quadrant, par année civile, à partir du 19e anniversaire : plusieurs quadrants (3 dents et/ou implants minimum pour l'ensemble des quadrants incomplets) | 01-10-2022 | |
| 309492-309503 | * Honoraires complémentaires pour les prestations de la rubrique traitements préventifs accessibles aux hygiénistes bucco-dentaires et effectuées par un hygiéniste bucco-dentaire chez les personnes avec des besoins particuliers dans les conditions de l'article 6, § 4quater, à partir du 19e anniversaire, par prestation | 01-10-2022 | |
| 371276-371280 | * Détartrage sous-gingival, avec surfaçage radiculaire si nécessaire, à l’aveugle, par quadrant et une fois toutes les trois années civiles, à partir du 18e jusqu’au 19e anniversaire : quadrant supérieur droit | 01-09-2023 | |
| 371291-371302 | * Détartrage sous-gingival, avec surfaçage radiculaire si nécessaire, à l’aveugle, par quadrant et une fois toutes les trois années civiles, à partir du 18e jusqu’au 19e anniversaire : quadrant supérieur gauche | 01-09-2023 | |
| 371313-371324 | * Détartrage sous-gingival, avec surfaçage radiculaire si nécessaire, à l’aveugle, par quadrant et une fois toutes les trois années civiles, à partir du 18e jusqu’au 19e anniversaire : quadrant inférieur gauche | 01-09-2023 | |
| 371335-371346 | * Détartrage sous-gingival, avec surfaçage radiculaire si nécessaire, à l’aveugle, par quadrant et une fois toutes les trois années civiles, à partir du 18e jusqu’au 19e anniversaire : quadrant inférieur droit | 01-09-2023 | |
| 371350-371361 | * Détartrage sous-gingival, avec surfaçage radiculaire si nécessaire, à l’aveugle, par quadrant et une fois toutes les trois années civiles, à partir du 18e jusqu’au 19e anniversaire : plusieurs quadrants (3 dents naturelle et/ou implants minimum pour l’ensemble des quadrants incomplets) | 01-09-2023 | |
| 371372-371383 | * Examen buccal parodontal, une fois par année civile, à partir du 18e jusqu’au 19e anniversaire | 01-09-2023 | |
| 371556-371560 | * Examen buccal comprenant l'établissement d'un bilan et la motivation du patient quant aux soins préventifs et curatifs, effectué au cours du premier semestre de l'année civile, une fois par semestre, jusqu'au 18e anniversaire | 01-09-2005 | 31-01-2018 |
| 371571-371582 | * Examen buccal préventif, comprenant l’établissement d’un bilan et la motivation du patient quant aux soins préventifs et curatifs,l’établissement d’un examen buccal, des instructions de brossage et si nécessaire un nettoyage prophylactique, une fois par année civile,uniquement au cours du deuxième semestre civil, jusqu’au 18e anniversaire | 01-09-2005 | |
| 371593-371604 | * Examen buccal y compris l’établissement d’un plan de traitement, l’enregistrement des données pour l’établissement ou la mise à jour du dossier dentaire et la motivation du patient concernant les soins préventifs et curatifs à effectuer, une fois par année civile, à partir du 18e jusqu’au 19e anniversaire | 01-09-2023 | |
| 371615-371626 | * Examen buccal préventif dans une année civile, comprenant l’établissement d’un bilan et la motivation du patient quant aux soins préventifs et curatifs, l’établissement d’un examen buccal, des instructions de brossage et si nécessaire un nettoyage prophylactique, une foispar année civile, uniquement au cours du premier semestre civil,jusqu’au 18e anniversaire | 01-02-2018 | |
| 371696-371700 | ** Nettoyage prophylactique, par quadrant, par trimestre, chez des handicapés, physiques ou mentaux, jusqu'au 19e anniversaire, qui ne sont pas en état d'acquérir ou de conserver une hygiène buccale quotidienne normale pour leur âge sans l'aide d'une tierce personne : quadrant supérieur droit | 01-09-2005 | |
| 371711-371722 | ** Nettoyage prophylactique, par quadrant, par trimestre, chez des handicapés, physiques ou mentaux, jusqu'au 19e anniversaire, qui ne sont pas en état d'acquérir ou de conserver une hygiène buccale quotidienne normale pour leur âge sans l'aide d'une tierce personne : quadrant supérieur gauche | 01-09-2005 | |
| 371733-371744 | ** Nettoyage prophylactique, par quadrant, par trimestre, chez des handicapés, physiques ou mentaux, jusqu'au 19e anniversaire, qui ne sont pas en état d'acquérir ou de conserver une hygiène buccale quotidienne normale pour leur âge sans l'aide d'une tierce personne : quadrant inférieur gauche | 01-09-2005 | |
| 371755-371766 | ** Nettoyage prophylactique, par quadrant, par trimestre, chez des handicapés, physiques ou mentaux, jusqu'au 19e anniversaire, qui ne sont pas en état d'acquérir ou de conserver une hygiène buccale quotidienne normale pour leur âge sans l'aide d'une tierce personne : quadrant inférieur droit | 01-09-2005 | |
| 371770-371781 | ** Nettoyage prophylactique, par quadrant, par trimestre, chez des handicapés, physiques ou mentaux, jusqu'au 19e anniversaire, qui ne sont pas en état d'acquérir ou de conserver une hygiène buccale quotidienne normale pour leur âge sans l'aide d'une tierce personne : plusieurs quadrants (3 dents et/ou implants minimum pour l'ensemble des quadrants incomplets) | 01-09-2005 | |
| 371792-371803 | * Nettoyage prophylactique, par quadrant et par année civile, jusqu'au 18e anniversaire : quadrant supérieur droit | 01-09-2005 | 31-01-2018 |
| 371814-371825 | * Nettoyage prophylactique, par quadrant et par année civile, jusqu'au 18e anniversaire : quadrant supérieur gauche | 01-09-2005 | 31-01-2018 |
| 371836-371840 | * Nettoyage prophylactique, par quadrant et par année civile, jusqu'au 18e anniversaire : quadrant inférieur gauche | 01-09-2005 | 31-01-2018 |
| 371851-371862 | * Nettoyage prophylactique, par quadrant et par année civile, jusqu'au 18e anniversaire : quadrant inférieur droit | 01-09-2005 | 31-01-2018 |
| 371873-371884 | * Nettoyage prophylactique, par quadrant et par année civile, jusqu'au 18e anniversaire : plusieurs quadrants (3 dents et/ou implants minimum pour l'ensemble des quadrants incomplets) | 01-09-2005 | 31-01-2018 |
| 372153-372164 | * Détartrage, par quadrant, par année civile, à partir du 18e jusqu’au 19e anniversaire : quadrant supérieur droit | 01-09-2023 | |
| 372175-372186 | * Détartrage, par quadrant, par année civile, à partir du 18e jusqu’au 19e anniversaire : quadrant supérieur gauche | 01-09-2023 | |
| 372190-372201 | * Détartrage, par quadrant, par année civile, à partir du 18e jusqu’au 19e anniversaire : quadrant inférieur gauche | 01-09-2023 | |
| 372212-372223 | * Détartrage, par quadrant, par année civile, à partir du 18e jusqu’au 19e anniversaire : quadrant inférieur droit | 01-09-2023 | |
| 372234-372245 | * Détartrage, par quadrant, par année civile, à partir du 18e jusqu’au 19e anniversaire : plusieurs quadrants (3 dents et/ou implants minimum pour l’ensemble des quadrants incomplets) | 01-09-2023 | |
| 372352-372363 | ** Nettoyage prophylactique effectué par un hygiéniste bucco-dentaire, par quadrant, par trimestre, chez des handicapés, physiques ou mentaux, jusqu'au 19e anniversaire, qui ne sont pas en état d'acquérir ou de conserver une hygiène buccale quotidienne normale pour leur âge sans l'aide d'une tierce personne : quadrant supérieur droit | 01-10-2022 | |
| 372374-372385 | ** Nettoyage prophylactique effectué par un hygiéniste bucco-dentaire, par quadrant, par trimestre, chez des handicapés, physiques ou mentaux, jusqu'au 19e anniversaire, qui ne sont pas en état d'acquérir ou de conserver une hygiène buccale quotidienne normale pour leur âge sans l'aide d'une tierce personne : quadrant supérieur gauche | 01-10-2022 | |
| 372396-372400 | ** Nettoyage prophylactique effectué par un hygiéniste bucco-dentaire, par quadrant, par trimestre, chez des handicapés, physiques ou mentaux, jusqu'au 19e anniversaire, qui ne sont pas en état d'acquérir ou de conserver une hygiène buccale quotidienne normale pour leur âge sans l'aide d'une tierce personne : quadrant inférieur gauche | 01-10-2022 | |
| 372411-372422 | ** Nettoyage prophylactique effectué par un hygiéniste bucco-dentaire, par quadrant, par trimestre, chez des handicapés, physiques ou mentaux, jusqu'au 19e anniversaire, qui ne sont pas en état d'acquérir ou de conserver une hygiène buccale quotidienne normale pour leur âge sans l'aide d'une tierce personne : quadrant inférieur droit | 01-10-2022 | |
| 372433-372444 | ** Nettoyage prophylactique effectué par un hygiéniste bucco-dentaire, par quadrant, par trimestre, chez des handicapés, physiques ou mentaux, jusqu'au 19e anniversaire, qui ne sont pas en état d'acquérir ou de conserver une hygiène buccale quotidienne normale pour leur âge sans l'aide d'une tierce personne : plusieurs quadrants (3 dents et/ou implants minimum pour l'ensemble des quadrants incomplets) | 01-10-2022 | |
| 372455-372466 | * Scellement de fissures et de puits d'une dent définitive effectué par un hygiéniste buccodentaire, par dent, jusqu'au 19e anniversaire | 01-10-2022 | |
| 372470-372481 | * Scellement de fissures et de puits d'une autre dent définitive effectué par un hygiéniste buccodentaire, au cours de la même séance et dans le même quadrant - par dent supplémentaire, jusqu'au 19e anniversaire | 01-10-2022 | |
| 372514-372525 | * Scellement de fissures et de puits d'une dent définitive, par dent, jusqu'au 19e anniversaire | 01-09-2005 | |
| 372536-372540 | * Scellement de fissures et de puits d'une autre dent définitive, au cours de la même séance et dans le même quadrant - par dent supplémentaire, jusqu'au 19e anniversaire | 01-09-2005 | |
| 372551-372562 | * Détartrage effectué par un hygiéniste bucco-dentaire, par quadrant, par année civile, à partir du 18e jusqu’au 19e anniversaire : quadrant supérieur droit | 01-09-2023 | |
| 372573-372584 | * Détartrage effectué par un hygiéniste bucco-dentaire, par quadrant, par année civile, à partir du 18e jusqu’au 19e anniversaire : quadrant supérieur gauche | 01-09-2023 | |
| 372595-372606 | * Détartrage effectué par un hygiéniste bucco-dentaire, par quadrant, par année civile, à partir du 18e jusqu’au 19e anniversaire : quadrant inférieur gauche | 01-09-2023 | |
| 372610-372621 | * Détartrage effectué par un hygiéniste bucco-dentaire, par quadrant, par année civile, à partir du 18e jusqu’au 19e anniversaire : quadrant inférieur droit | 01-09-2023 | |
| 372632-372643 | * Détartrage effectué par un hygiéniste bucco-dentaire, par quadrant, par année civile, à partir du 18e jusqu’au 19e anniversaire : plusieurs quadrants (3 dents et/ou implants minimum pour l’ensemble des quadrants incomplets) | 01-09-2023 | |
| 379492-379503 | * Honoraires complémentaires pour les prestations de la rubrique traitements préventifs accessibles aux hygiénistes bucco-dentaires et effectuées par un hygiéniste bucco-dentaire chez les personnes avec des besoins particuliers dans les conditions de l'article 6, § 4quater, jusqu'au 19e anniversaire, par prestation | 01-10-2022 |
The codes mentioned above can be used in rates and expenses, or only in expenses. We invite you to consult the full report for more information.
Below is a graph showing the evolution of the breakdown by volume of nomenclature codes used for the rates:
")
Population selection
No selection
Analysis period
2024
Graphics
 Nomenclature codes
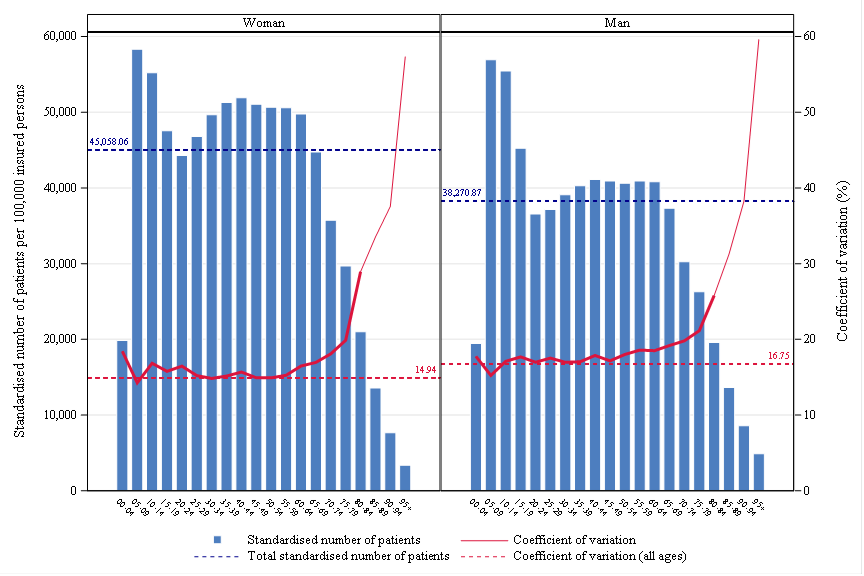
 Age, gender and CV
 Rates by sex
 Reimbursement rate
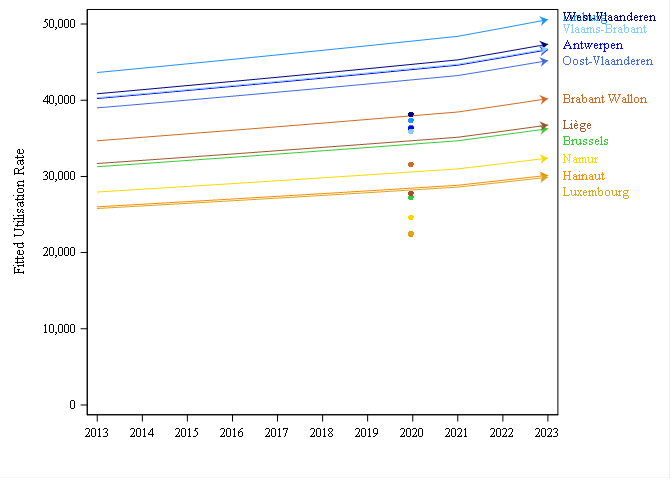
 Trends by region
 Trends break
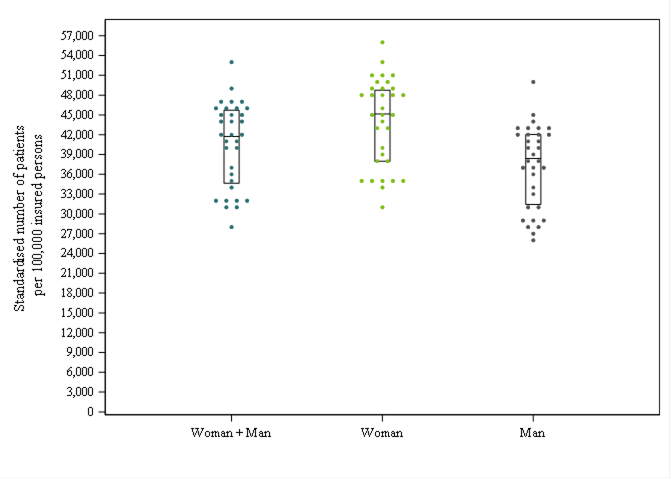
 Dot Plot
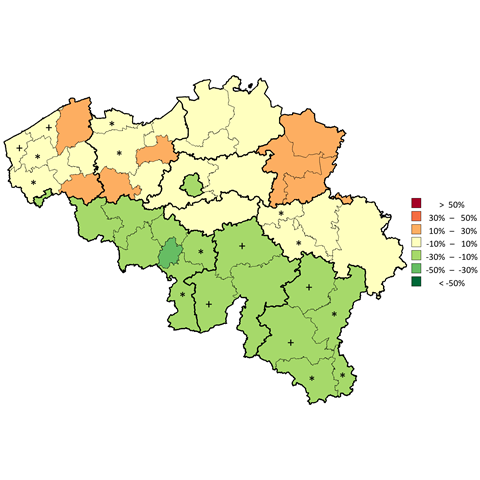
 Distribution map
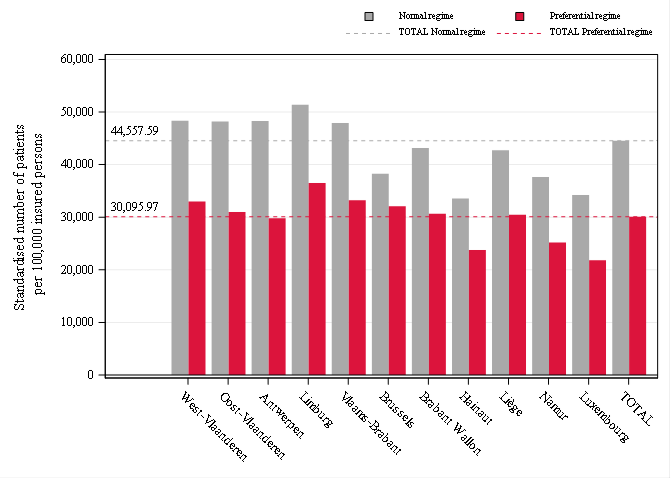
 Expenses Distribution map
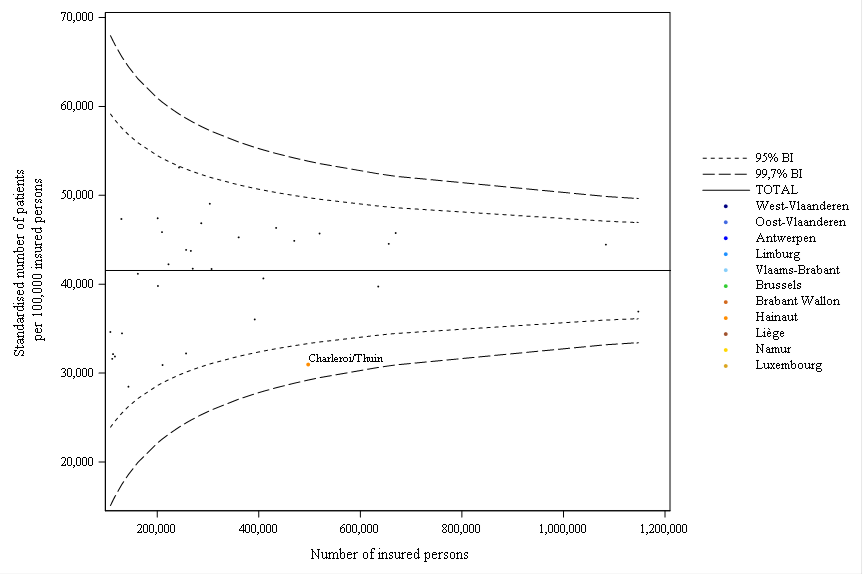
 Funnel plot
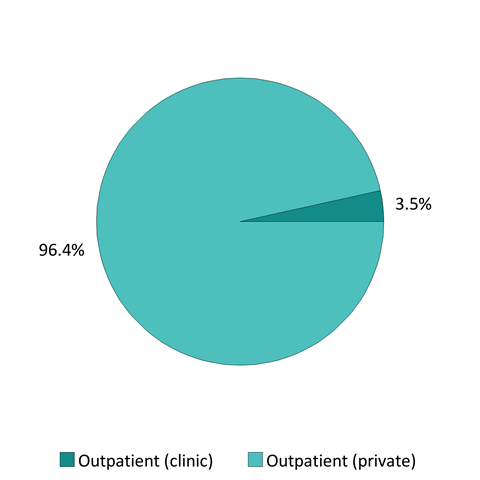
 Patient care settings
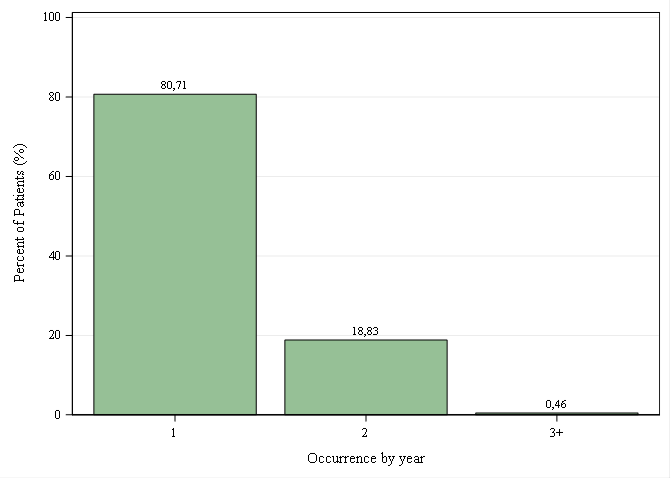
 Occurrences per year
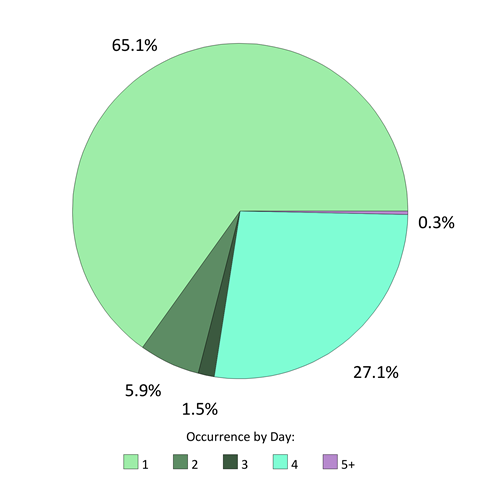
 Occurrences per day


Comments
WE ARE INTERESTED IN YOUR OPINION
Do you have any experience in this area ? We listen to you !