The care for people faced with severe psychiatric issues has long been concentrated mostly in dedicated hospitals or wards. In recent years, however, Western countries have attempted to develop a more community-based approach to mental health care, to allow patients to remain in their familiar environment and among their loved ones as much as possible. This approach is known as deinstitutionalisation. Similar initiatives have been launched in Belgium as of 2010.
Mental health issues are arguably among the most challenging to address for a variety of reasons, not least because they typically do not cause physical symptoms and patients are not always aware of the need for treatment – or, indeed, willing to accept it. Particularly in more severe cases, mental health issues can also cause a variety of personal, social and financial difficulties which further complicate (access to) care.
Adequate availability, organisation and funding of mental health care are crucial to address the very real suffering those issues cause, but may be hampered by the lack of visibility and recognition of mental health struggles. In Belgium, these difficulties may be amplified by the fact the responsibility for this sector is spread over communities, regions and the federal level (e.g. psychiatrists’ fees and psychiatry departments in hospitals are covered by the national health insurance, while outpatient services are organised and funded by the federated entities). This also means there is no single, standardised source of data covering the entire mental health care system, which makes it extremely difficult to assess its performance as a whole.
This section covers 10 indicators relating to various dimensions of mental healthcare:
- The number of practicing psychiatrists per 10 000 population (MH-2), the number of psychologists registered with NIHDI per 10 000 population (MH-12) and the waiting times for a first appointment with an outpatient mental health facility (MH-3), which all relate to the accessibility of mental healthcare.
- The rate of involuntary committals in psychiatry units (MH-4), the percentage of visits to the emergency room due to social, psychological or mental health issues (MH-5) and various indicators on the use of antidepressants (MH-6, MH-7, MH-8), which relate to the appropriateness of care.
- The percentage of repeat hospitalisations in a psychiatry department within 30 days of discharge (MH-11), which can point to various aspects of quality of care, like (a lack of) effectiveness, continuity and coordination with outpatient services.
- The total number of days spent in inpatient psychiatric facilities (MH-10) is a contextual indicator, but also relates indirectly to dimensions like accessibility and appropriateness of care.
a Data are for Flanders only.


Number of practicing psychiatrists per 10 000 population (MH-2)
While psychiatrists are not the only providers involved in mental health care, in most countries, they do have a crucial role in this sector, particularly for people faced with severe issues. This makes the number of practicing psychiatrists a valuable indicator of the accessibility of mental health care.
Results
- In 2021, the number of practising psychiatrists in Belgium was 2011, which comes down to 1.74/10 000 inhabitants. This is both a substantial increase in numbers and a modest increase in density compared to 2011 (headcount 1865, 1.69/10 000).
- About 90% of psychiatrists are conventioned, which means they charge agreed-upon prices for their services.
- In 2021, the density of psychiatrists was twice as high in Brussels (3.30/10 000) as in Flanders (1.50/10 000) and Wallonia (1.64/10 000). However, these figures are based on their home address, which doesn’t necessarily coincide with their workplace.
- In 2021, the density of practising psychiatrists in Belgium was below both EU-14 and EU-27 averages (2.07 and 1.84/10 000).
Link to the technical sheet and detailed results
Data source: INAMI - RIZIV (based on the home address of the psychiatrist); calculation: KCE
Data source: CIC, FPS Health, Food Chain Safety and Environment (1/01/2020)
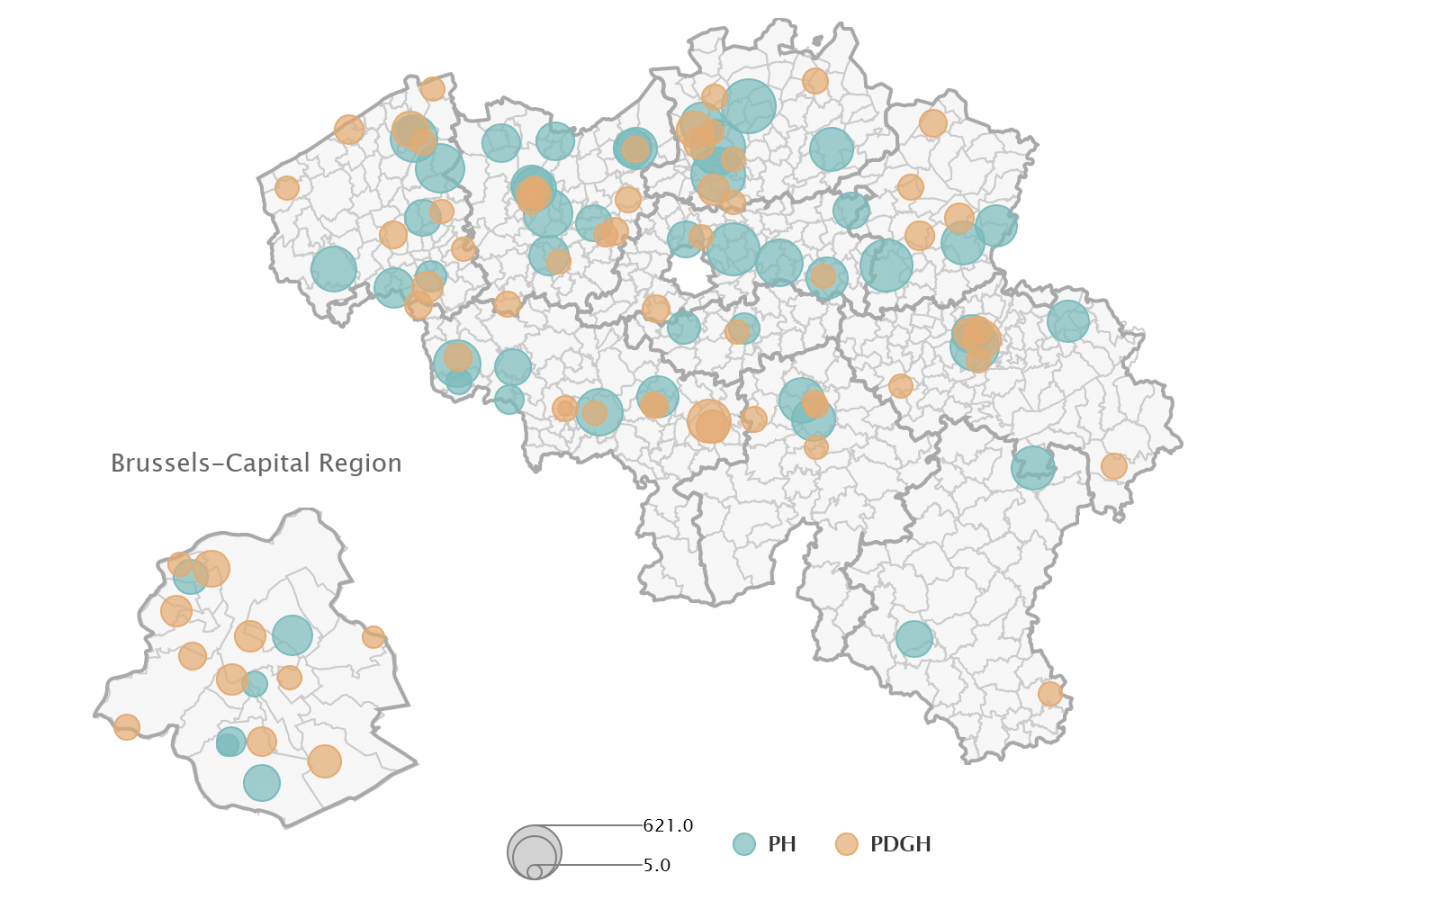
Note: the size of the circles indicate the number of beds for adults.
Number of psychologists registered with NIHDI per 10 000 population (MH-12)
Together with psychiatrists and GPs, psychologists are among the healthcare providers most closely involved in tending to the mental health and psychological well-being of the population.
The COVID-19 pandemic has led a lot of countries to increase available funds for psychological care or therapies. Aside from a 16.7 million euro boost to psychological care for children/teenagers and older people, Belgium has launched a new “mental health master plan” in January 2022. Among other measures, this entails the reimbursement of a certain number of sessions with a registered psychologist (i.e. one who has signed a formal agreement with a care network, which involves a number of obligations like a multidisciplinary approach, compulsory supervision and participation in training activities organised by the network), which contributes to improve access to affordable mental health care.
To date, only a small fraction of all licensed clinical psychologists are also registered with NIHDI, possibly because the reform is still very recent. The number of registered psychologists will be a valuable source of information regarding its uptake in the future.
Results
- In 2022, the density of registered clinical psychologists in Belgium was 2.5/10 000 population; the density of licensed clinical psychologists was 12.5/10 000. About 20% of licensed clinical psychologists are also registered with NIHDI.
- The density of registered psychologists was slightly higher in Wallonia (2.62/10 000) than in Flanders (2.42/10 000) and Brussels (2.29/10 000). However, like for psychiatrists, these figures are based on their home address, which might be different from their workplace.
Link to the technical sheet and detailed results
Waiting time for a first and second face-to-face contact with an outpatient mental health facility (Flanders only) (MH-3)
Long waiting times to access necessary (mental) healthcare are problematic for a variety of reasons. There is a very real risk the patient might get worse while waiting for treatment, which can lead to more complications, more hospital stays, higher costs and even suicide. When patients have to wait too long for their (next) appointment, they are also more likely not to show up or even to lose touch with their healthcare provider altogether and stop their therapy, which might yet again cause them to get worse. This makes timely access to necessary services a crucial factor to improve mental health care as a whole, and several European countries have set targets or introduced guarantees for limiting waiting times in at least some areas of mental health care, with most of them aiming to provide treatment or a first contact within 1-3 months.
For this indicator, we have used the only publicly available data, which relate to the waiting times in the 18 Flemish centres for ambulatory mental health care scattered over Flanders and Brussels.
Results
- In 2022, the average waiting time from enrolment to first face-to-face contact in Flemish ambulatory mental health centres was 41 days. The average time between first and second face-to-face contact was 48 days. This is an improvement (-10 days) compared to the 2016-2021 period.
- On average, waiting times were longer for children and teenagers than for other age groups (46 days on average before a first contact, 54 before a second contact).
- Waiting times also varied depending on the type of care. They were particularly long to access specific care for people with mental disabilities (217 days on average before a first contact), much less so, for instance, for care for older people (21 days on average). Access to crisis care took an average of 14 days; for addiction care, the delay was 38 days on average.
Link to the technical sheet and detailed results
Rate of involuntary committals in psychiatric hospital wards (/10 000 population) (MH-4)
Involuntary committal or placement under observation refers to situations where patients who are mentally ill are forced to stay in a psychiatric hospital or ward against their will because, at that point in time, they are considered a threat to themselves and/or others and no other suitable options are available to deal with this situation. It can only be decided when all three criteria – mental illness, threat to self or society, absence of alternatives – are met, which will typically happen in the context of a crisis episode.
Involuntary committal has to be ordered by a magistrate and is subject to strict rules in terms of e.g. duration (initial period limited to 40 days), though an extension is possible if necessary. Even so, this obviously remains a coercive measure which the health system must strive to use – and need! – as little as possible, whilst ensuring that patients with serious psychiatric issues still receive all necessary and appropriate care, supervision and protection.
Thus, the rates of involuntary committals can shed a light on the ability of the mental health sector to provide appropriate, effective, accessible and equitable care to all patients living with a psychiatric disorder, both during a crisis and overall, to prevent such episodes from happening.
Results
- In Belgium, the overall rate of involuntary committals increased from 7.1/10 000 in 2010 to 9.4/10 000 in 2021. Rates differ between regions and are substantially higher in Brussels (10.2/10 000 in 2021) than in Flanders (9.2/10 000) and Wallonia (8.2/10 000).
- In 2020, 87% of involuntary committals took place in psychiatric hospitals (as opposed to psychiatric services in general hospitals). However, the number of involuntary committals has increased much faster in general hospitals than in psychiatric hospitals over recent years.
- The average length of stay of involuntary committals fell from 171 days in 2012 to 90 days in 2021. This decrease was observed across regions, but the average length of stay remained considerably higher in Flanders (101 days in 2021) and Wallonia (86 days) than in Brussels (53 days).
- In 2021-2022, the proportion of adult psychiatric admissions that were involuntary was lower in Belgium (10%) than in a selection of other countries and regions, including New Zealand, the UK, Ireland, Switzerland, Sweden and Canada (mean: 30%, median: 23%).
Link to the technical sheet and detailed results
Data source: SPF SPSCAE - FOD VVVL
Emergency Room visits due to social, psychological or mental health reasons (% of ER admissions in general hospitals) (MH-5)
The purpose of ER units in hospitals is to provide unscheduled care to patients faced with a medical issue requiring immediate attention, especially in cases where regular services cannot be accessed without delay. While such emergencies can certainly relate to mental health or social issues as well as to physical health, an excess of ER visits due to such causes can also indicate poor coordination of care or a failure of other mental health services to fulfil their role. When outpatient care is available, appropriate and readily accessible, people with psychological or psychiatric issues should mostly have received the help they needed well before reaching the crisis stage which might make an ER visit necessary.
Results
- The percentage of ER visits for social or mental health-related problems – including suicide attempts – has remained relatively stable over time in Belgium (1.71% of all ER admissions in 2010, 1.80% in 2021), with a slightly increasing trend in Flanders and a decreasing trend in Wallonia (before the COVID-19 pandemic).
- In 2021, 1.64% of ER admissions in Belgium were due to social, psychological or mental health-related issues (excluding suicide attempts). This figure was highest in Flanders (1.88%, vs 1.72% in Brussels and 1.30% in Wallonia).
- In 2021, 0.16% of ER admissions in Belgium were related to suicide attempts. This figure was highest in Wallonia (0.25%, vs 0.13% in Flanders and 0.06% in Brussels).
- The share of ER admissions for all social and mental health issues varied considerably between districts within regions.
Link to the technical sheet and detailed results
Data source:
Note: No data for the following districts: Ath, Bastogne, Diksmuide, Philippeville, Virton and Waremme
Antidepressant medication (MH-6, MH-7, MH-8)
Antidepressants are used for treating severe depression, panic and anxiety disorder and obsessive-compulsive disorder. The use of this group of drugs has skyrocketed in many Western countries over the last couple of decades, but the reason for this is unclear. It is possible that depression and related diseases have become more frequent, or that more patients are diagnosed and treated as medical knowledge progresses and mindsets change. However, several Belgian studies have also found that antidepressant medications are not always used appropriately – for instance, they might be prescribed in situations where they are not necessary (e.g. mild depression), or for a period of time too short to be effective (e.g. less than 3 months/6 months in a patient with major depression).
This section covers three distinct indicators relating to the total use of antidepressants in the population (number of DDD/1000 population/day) (MH-6), to the percentage of the adult population who take antidepressants at least once a year (MH-7) and to the percentage of the adult population under antidepressants who receive the treatment for a short period of time (MH-8).
The defined daily dose or DDD of a medication is the average daily dose that is recommended in adults. In other words, an average of 100 DDD/1000 pop./day means that, assuming all patients receive a ‘normal’ dose, an average of 100 people out of 1000 are taking this type of medication on any given day. For clarity’s sake, we will simply refer to “daily doses” in the results below.
Results
- The average number of daily doses per 1000 population has increased from 69.6 in 2010 to 86.5 in 2021. Use of antidepressant drugs increases with age, is twice as high in women as in men and is much higher in Wallonia than in the rest of the country.
- Though similar trends are observed in all European countries, Belgian figures for 2021 were above the EU-14 (77 daily doses/1000 pop.) and the EU-27 average (64 daily doses/1000 pop.).
- In 2021, 13.7% of Belgian adults received antidepressant medication at least once a year. This percentage has remained relatively stable over time. Trends by age, gender and region were similar to those observed for the total number of daily doses.
- Use of antidepressants was particularly high in people over 75 years old living in nursing homes (47.3% vs 19.0% in people of the same age living at home).
- In 2020, 18.3% and 12.4% of adults under antidepressants respectively were treated for short (<6 months) or very short periods of time (<3 months). This is an improvement compared to 2011, where this share amounted to 23.7% and 18.2% respectively.
- Short or very short antidepressant treatments were more frequent in men, in younger people and in those living in Brussels. Among older people, short-term antidepressant treatments were more frequent in people living at home (particularly without long-term care) than in those who lived in nursing homes.
Link to the technical sheet and detailed results
Data source: Pharmanet - Farmanet ; calculation: INAMI – RIZIV
Data source: IMA - AIM
Data source: IMA - AIM
Number of hospitalisation days in psychiatric hospital wards (/1000 population) (MH-10)
While this indicator in and of itself only captures a very small portion of mental health service users (i.e. those who stay in a psychiatric ward or clinic), it can also reflect what is going on in other parts of the mental health sector. For instance, it can highlight regional differences in the mental health status of the population or in the availability, accessibility and effectiveness of other services. Health systems increasingly try to organise mental health care in the patients’ environment rather than in hospital wards or psychiatric institutions and, if this new model is working, the number of psychiatric hospitalisation days should show a clear decrease.
Results
- As could be expected following the reforms initiated in 2010 to deinstitutionalise mental health care in Belgium, the number of psychiatric hospitalisation days fell from 789/1000 inhabitants in 2012 to 550/1000 in 2021.
- This decreasing trend was observed across regions, but figures remain considerably higher in Flanders (609/1000 in 2021) than in Wallonia (455/1000) and Brussels (344/1000).
- In 2021, the number of psychiatric hospitalisation days was somewhat higher in men than in women (575 vs 515/1000), and substantially higher in the active population aged 18-64 years (685/1000) than in younger (188/1000) or older people (472/1000).
Link to the technical sheet and detailed results
Readmissions within 30 days in psychiatric hospital wards (in the same hospital, % of admissions) (MH-11)
This indicator is often used as a proxy for relapse or complications and can reflect various aspects of quality of care, like (a lack of) effectiveness, continuity and coordination with outpatient services: if a person has to come back to a psychiatric hospital or ward shortly after a previous stay, this might mean that they have been discharged too early or that community-based care did not adequately take over.
Results
- The rate of readmissions within 30 days is on the rise in Belgium, increasing from 13.17% in 2010 to 17.64% in 2021. No EU comparison is available, but based on figures from the British NHS this seems somewhat higher than in similar countries (mean and median: 12%).
- This rate has long been higher in Flanders than in Brussels and Wallonia, but this was partly due to anomalies in data collection. In 2021, following a sharp increase (+63% since 2019), Brussels sported a substantially higher 30-day readmission rate (23.15%) than Wallonia (17.24%) and Flanders (17.08%).
Link to the technical sheet and detailed results
Data source: IMA - AIM