Keyword: imaging
Key figures
On this table, when a statistical test has been performed, the data showing a significant difference is displayed on a yellow background, otherwise on a grey background.
Data
NIHDI nomenclature codes selected for analysis
| CODES | LABEL | CREATION | DELETION |
| 460191 460202 |
Echographie bidimensionnelle avec protocole écrit et support iconographique issu d'un traitement digital des données, quel que soit le nombre d'échogrammes_De l'abdomen : Les reins et/ou les glandes surrénales et/ou le rétropéritoine et/ou les vaisseaux sanguins | 01-06-1991 | |
| 460235 460246 |
Echographie bidimensionnelle avec protocole écrit et support iconographique issu d'un traitement digital des données, quel que soit le nombre d'échogrammes : Du bassin masculin | 01-06-1991 | |
| 460250 460261 |
Echographie bidimensionnelle avec protocole écrit et support iconographique issu d'un traitement digitale des données quel que soit le nombre d'échogrammes : Du bassin féminin | 01-06-1991 | |
| 460272 460283 |
Echographie bidimensionnelle avec protocole écrit et support iconographique issu d'un traitement digital des données quel que soit le nombre d'échogrammes : Du scrotum | 01-06-1991 | |
| 460493 460504 |
Echographie bidimensionnelle avec protocole écrit et support iconographique issu d'un traitement digital des données quel que soit le nombre d'échogrammes : Echographie transrectale | 01-06-1991 | |
| 460611 460622 |
Echographie bidimensionnelle avec protocole écrit et support iconographique issu d'un traitement digital des données quel que soit le nombre d'échogrammes : Echographie bidimensionnelle urinaire complète, non cumulable avec les prestations n°s 460191 - 460202, 460235 - 460246, 460250 - 460261 | 01-11-1992 | |
| 460832 460843 |
Echographie bidimensionnelle avec protocole écrit et support iconographique issu d'un traitement digital des données quel que soit le nombre d'échogrammes : Echographie transvaginale | 01-04-1997 | |
| 469291 469302 |
Echographie du petit bassin, quelle que soit la voie d'accès, quelle que soit la sonde, avec ou sans examen duplex couleur des vaisseaux sanguins pelviens, réservée aux gynécologues | 01-06-2010 | |
| 469453 469464 |
Echographie bidimensionnelle avec protocole écrit et support iconographique issu d'un traitement digital des données quel que soit le nombre d'échogrammes - De l'abdomen : Les reins et/ou les glandes surrénales et/ou le rétropéritoine et/ou les vaisseaux sanguins | 01-04-2003 | |
| 469475 469486 |
Echographie bidimensionnelle avec protocole écrit et support iconographique issu d'un traitement digital des données quel que soit le nombre d'échogrammes : Du bassin masculin | 01-04-2003 | |
| 469490 469501 |
Echographie bidimensionnelle avec protocole écrit et support iconographique issu d'un traitement digital des données quel que soit le nombre d'échogrammes : Du bassin féminin | 01-04-2003 | |
| 469512 469523 |
Echographie bidimensionnelle avec protocole écrit et support iconographique issu d'un traitement digital des données quel que soit le nombre d'échogrammes : Du scrotum | 01-04-2003 | |
| 469556 469560 |
Echographie bidimensionnelle avec protocole écrit et support iconographique issu d'un traitement digital des données quel que soit le nombre d'échogrammes : Echographie urinaire complète | 01-04-2003 | |
| 469571 469582 |
Echographie bidimensionnelle avec protocole écrit et support iconographique issu d'un traitement digital des données quel que soit le nombre d'échogrammes : Echographie transrectale | 01-04-2003 | |
| 469593 469604 |
Echographie bidimensionnelle avec protocole écrit et support iconographique issu d'un traitement digital des données quel que soit le nombre d'échogrammes : Echographie transvaginal | 01-04-2003 |
The codes mentioned above can be used in rates and expenses, or only in expenses. We invite you to consult the full report for more information.
Below is a graph showing the evolution of the breakdown by volume of nomenclature codes used for the rates:
 (2023)")
Population selection
Women only (no age selection)
Analysis period
2023
Graphics
 Nomenclature codes
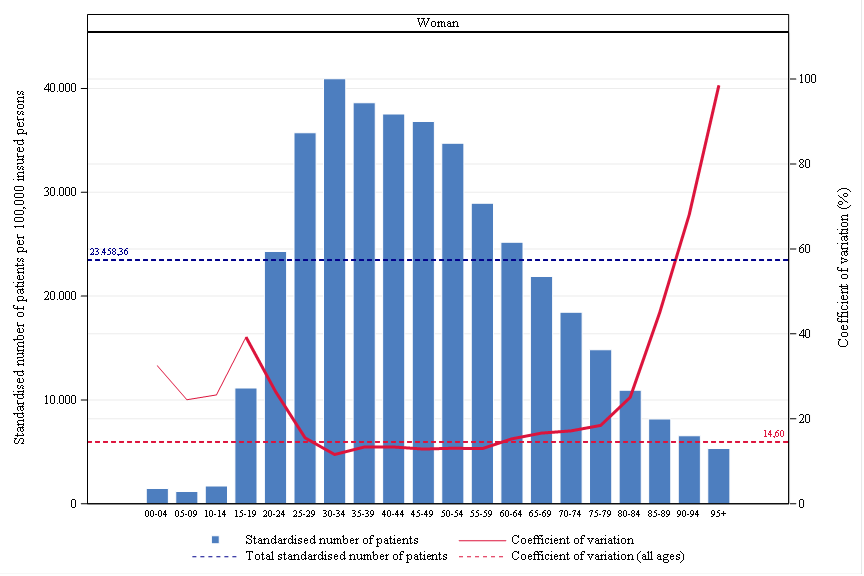
 Age, gender and CV
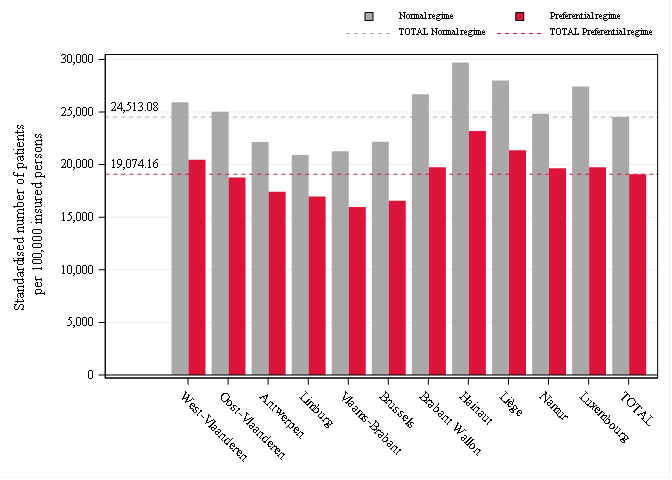
 Rates by sex
 Reimbursement rate
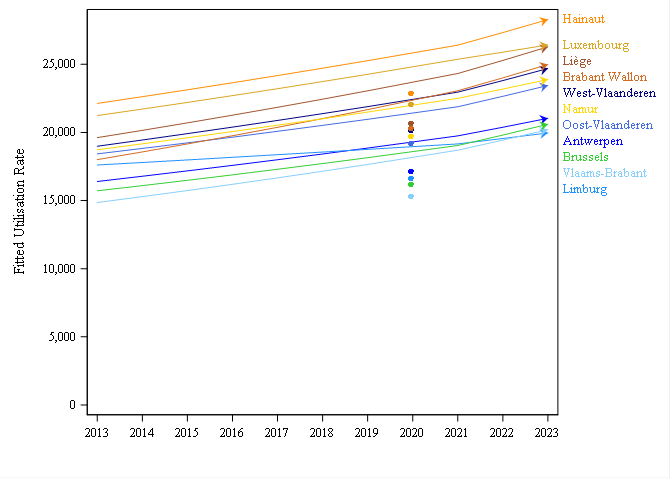
 Trends by region
 Trends break
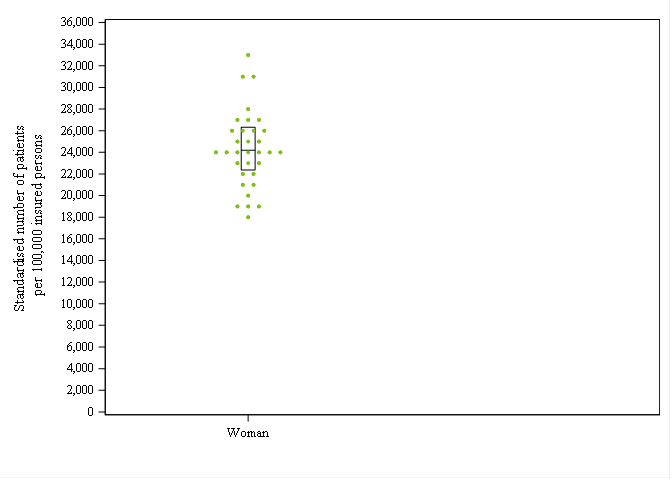
 Dot Plot
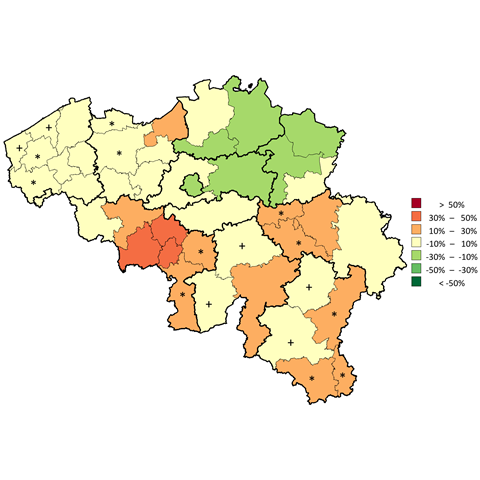
 Distribution map
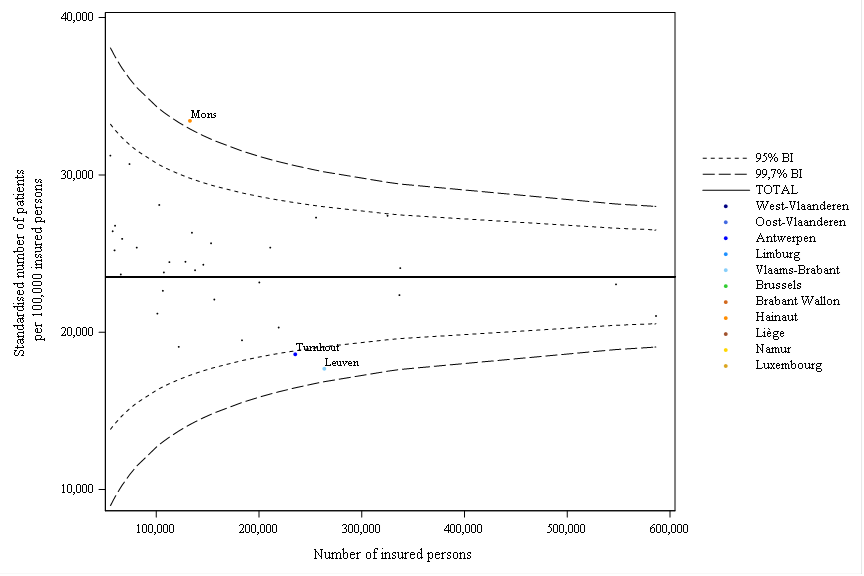
 Funnel plot
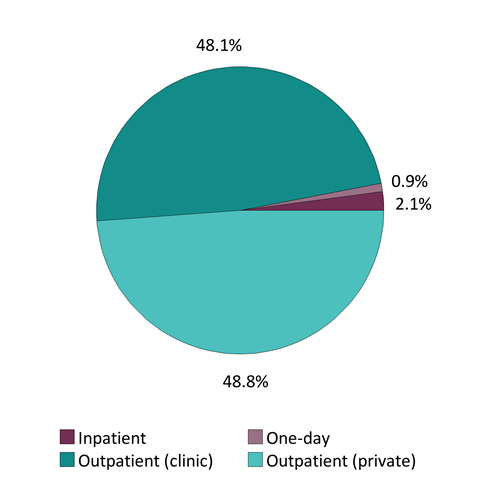
 Patient care settings
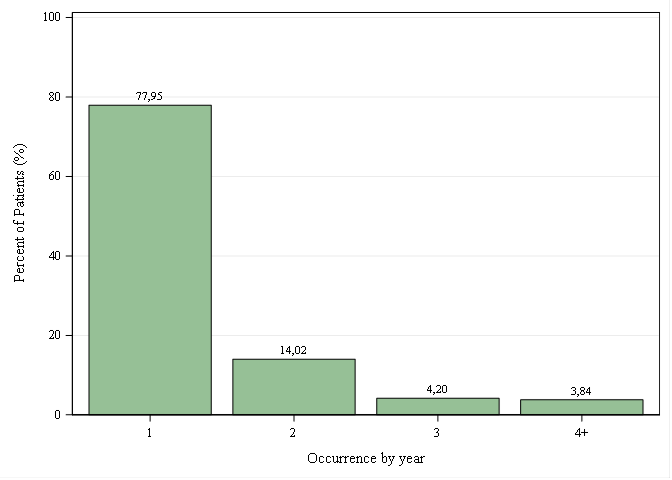
 Occurrences per year
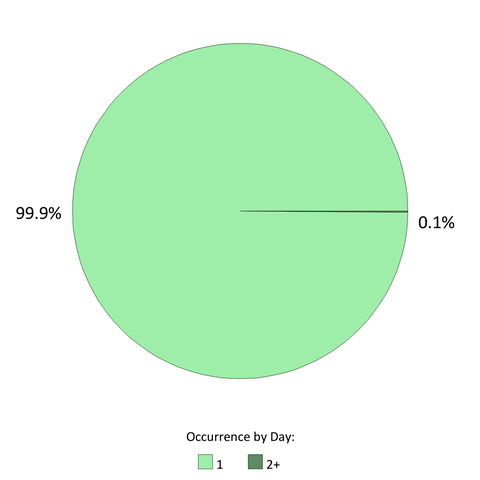
 Occurrences per day


Comments
WE ARE INTERESTED IN YOUR OPINION
Do you have any experience in this area ? We listen to you !