Key figures
On this table, when a statistical test has been performed, the data showing a significant difference is displayed on a yellow background, otherwise on a grey background.
Data
NIHDI nomenclature codes selected for analysis
| CODES | LABEL | CREATION | DELETION |
| 181974 181985 |
Ensemble des micro-stents de pontage trabéculaire, pour la chirurgie micro-invasive du glaucome, par œil | 01-10-2021 | |
| 246551 246562 |
Iridectomie | 01-04-1985 | |
| 246573 246584 |
Intervention chirurgicale pour glaucome | 01-04-1985 | |
| 248231 248242 |
Iridotomie par laser, par séance (maximum 2 séances) | 01-08-1988 | |
| 248253 248264 |
Trabéculoplastie ou iridoplastie par laser, par séance (maximum 2 séances) | 01-08-1988 |
The codes mentioned above can be used in rates and expenses, or only in expenses. We invite you to consult the full report for more information.
Below is a graph showing the evolution of the breakdown by volume of nomenclature codes used for the rates:
")
Population selection
No selection
Analysis period
2023
Graphics
 Nomenclature codes
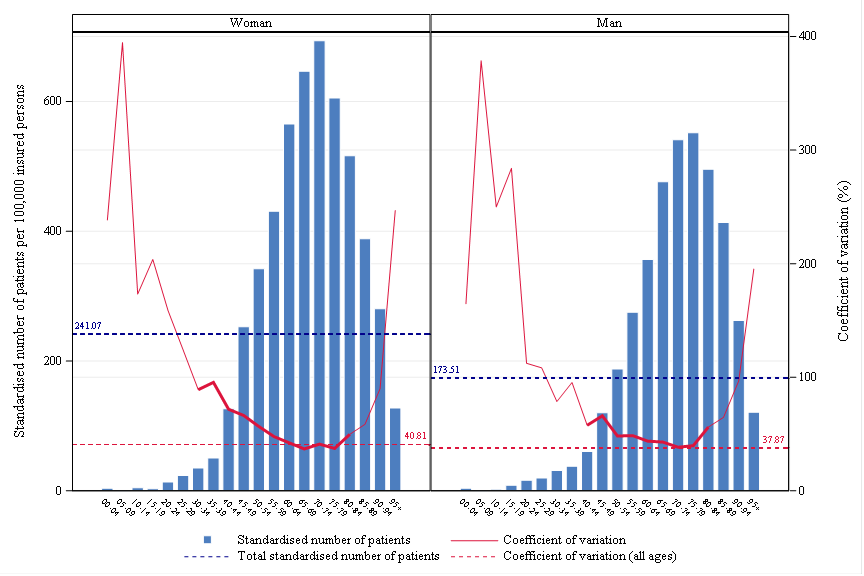
 Age, gender and CV
 Rates by sex
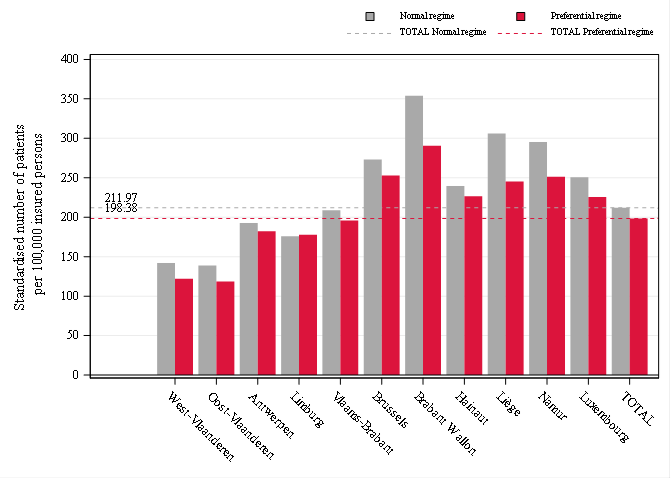
 Reimbursement rate
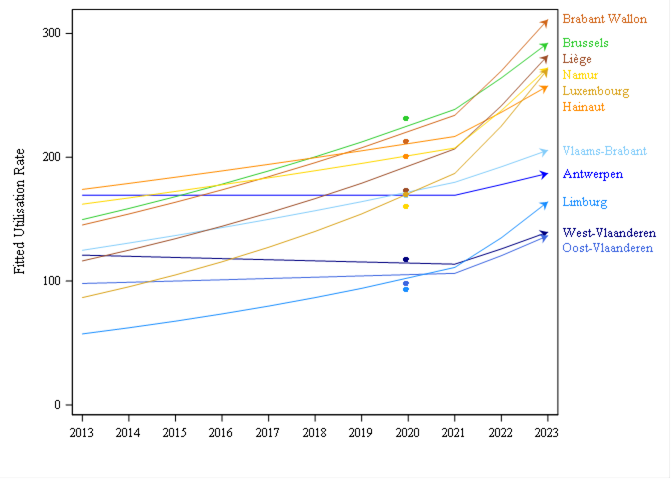
 Trends by region
 Trends break
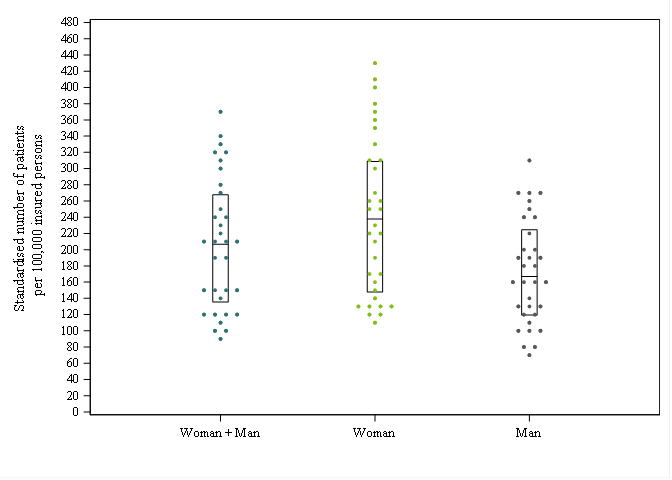
 Dot Plot
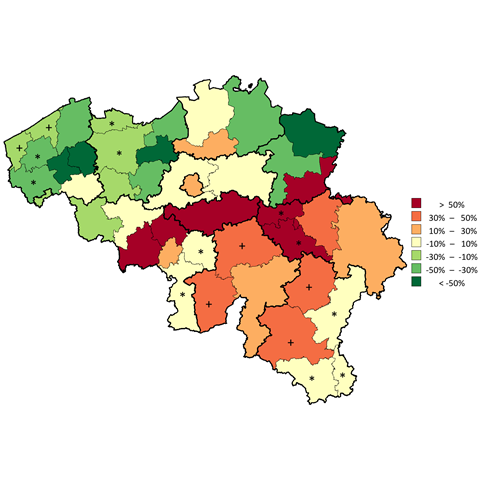
 Distribution map
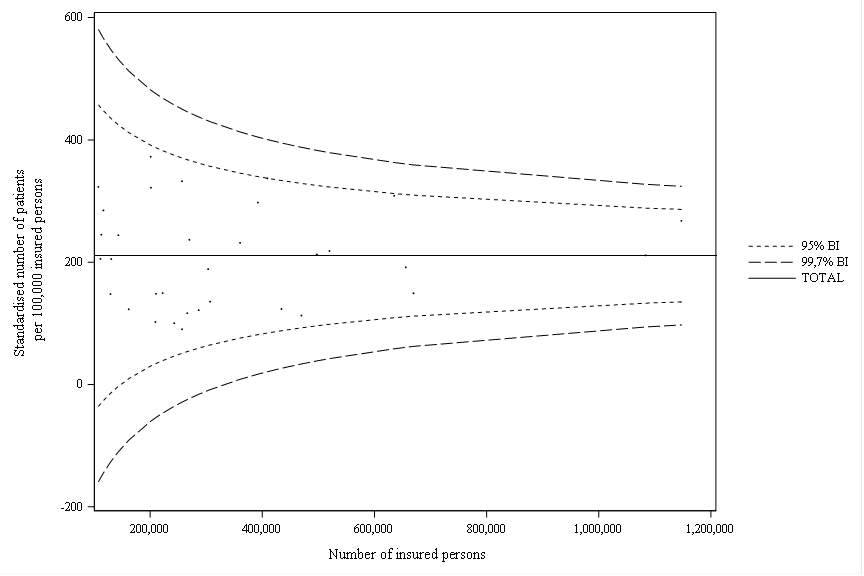
 Funnel plot
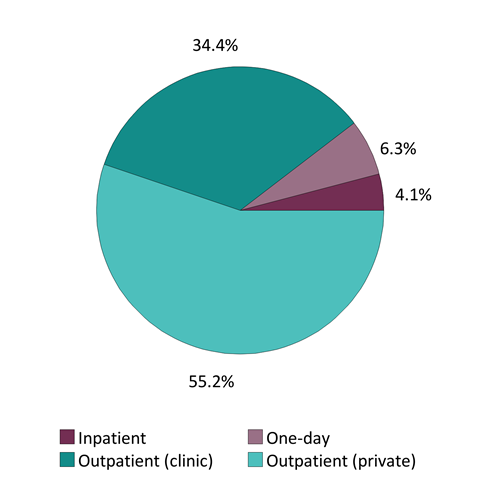
 Patient care settings
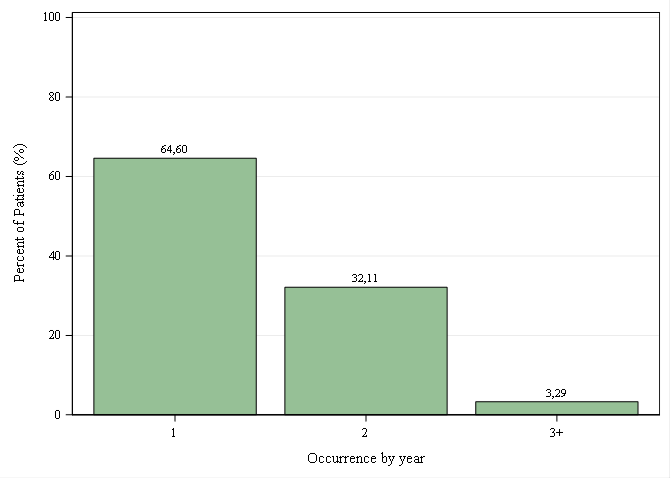
 Occurrences per year
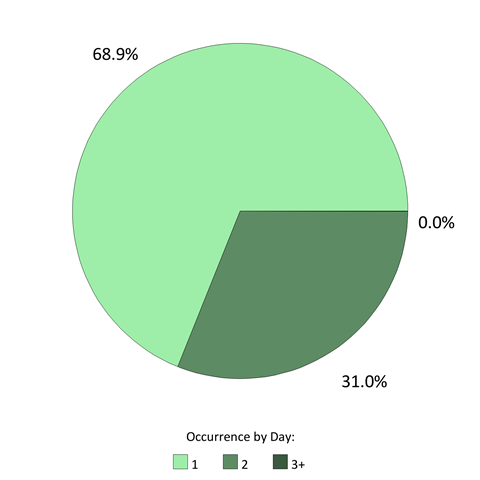
 Occurrences per day


Comments
WE ARE INTERESTED IN YOUR OPINION
Do you have any experience in this area ? We listen to you !