1. Key messages
- Poor air quality, caused by pollutants such as particulate matter, nitrogen dioxide, and ozone, is an important contributor to disease and premature mortality.
- Although ambient air quality in Belgium is generally improving, a considerable part of the population is still breathing contaminated air.
- There are important regional differences in Belgium, where exposure to particulate matter is highest in the Flemish Region and exposure to nitrogen dioxide is highest in the Brussels-Capital Region.
- Air quality in Belgium is poor by international standards, ranking below-average compared to similar EU countries for most pollutants.
2. Particulate matter
Particulate matter (PM) refers to all the fine particles suspended in the air. It is not a single chemical substance but a mixture of many different components and is usually referred to by its size. Generally, a distinction is made between PM with a diameter smaller than 10 micrometres (PM10) and with a diameter smaller than 2.5 micrometres (PM2.5). As PM2.5 only contains the smaller particles of PM, its composition and health effects are different compared to PM10.
Household heating is the most important direct source of fine particulate matter
According to the most recent Belgian figures (2021), the most important direct source of PM2.5 is heating by households, which to a large extent use fossil fuels or wood products. Other major sources of direct PM emissions are transport, mostly from road traffic, and industry and waste treatment. Although road traffic is not the leading source of PM emissions, it is nonetheless significant for exposure as local emissions may be high in densely inhabited areas [1].
Regulations, such as the European emission standards, and the introduction of hybrid and electric vehicles, have proven successful in mitigating exhaust PM emissions. However, policies so far have largely overlooked the so-called non-exhaust emissions from motorized traffic, resulting from the wear of tyres and brakes and the abrasion of roads [2]. According to the Belgian figures reported for 2021, three quarters of road traffic PM2.5 results from non-exhaust emissions, and this share rises to 85% for PM10 [3].
Aside from direct emissions, PM can also be formed from precursors through chemical reactions occurring in the air. The most important precursors of indirect PM are ammonia, nitrogen oxides and sulphur dioxide. Ammonia is primarily emitted by the agricultural sector, and especially by livestock. Sulphur dioxide, itself an air pollutant, originates mostly from heavy industry and energy production [1].
Exposure to particulate matter can lead to cardiovascular and respiratory diseases and lung cancer
When inhaled, PM can be absorbed by the lung tissue and cause respiratory disorders. The smaller of the absorbed particles can enter the bloodstream and harm other organs. PM contains toxic and carcinogenic components that are linked to a variety of adverse health effects.
It is well established that prolonged exposure to PM can cause respiratory diseases, more precisely emphysema, chronic bronchitis, and pneumonia [4,5]. PM exposure also causes cardiovascular diseases, with strong evidence of links to stroke and ischemic heart disease [4,6]. Other well-established effects include lung cancer [7] and type 2 diabetes [8]. The evidence also suggests an impact on mental health, namely an increased risk of depression [9]. All of these conditions are debilitating and can contribute to a severe loss in quality of life and premature death [4].
PM exposure puts women and their infants at risk as exposure has been linked to perinatal conditions including premature birth, lower birth weight, and miscarriage [10,11,12]. Children are also identified as a vulnerable group susceptible to the effects of PM. Exposure plays a role in the development of asthma, and can also trigger asthma attacks resulting in more emergency room visits and hospitalisation [13,14]. More recent evidence points to consequences for brain development, where exposure to PM during pregnancy and early life increases the risk of autism spectrum disorder [15].
Particulate matter concentrations are higher in The Flemish Region and Brussels capital region compared to the Walloon region
To visualise exposure to PM in Belgium, yearly average PM2.5 and PM10 concentrations are mapped for each statistical sector. The values are shown relative to the WHO’s air quality guideline level for the pollutant, as an indication of exposure in the local community compared to the advised value: 5 µg m-3 annual mean concentration for PM2.5, and 15 µg m-3 annual mean concentration for PM10 [16].
As evidenced in the air quality map for PM2.5, concentrations generally decrease from North to South. Pollution levels are relatively high in the Flemish Region and the Brussels Capital Region, and low to intermediate in the Walloon Region. The same pattern appears for PM10, with the difference that relative pollution levels are generally lower compared to PM2.5.
This regional pattern is likely a result of differences in population density and vegetation. The Flemish Region is more densely-populated and has more PM sources (residential heating, transport, agriculture including intensive livestock) and less sinks (removal by vegetation) compared to the Walloon Region. While about half of the territory has pollution levels above the long-term WHO guideline value for PM10, 97% of the area has levels above the guideline for PM2.5.
- PM2.5
- PM10
Relative concentration of PM2.5 per statistical sector in Belgium, 2021
Source: Own calculations based on air pollution data provided by IRCEL-CELINE [17].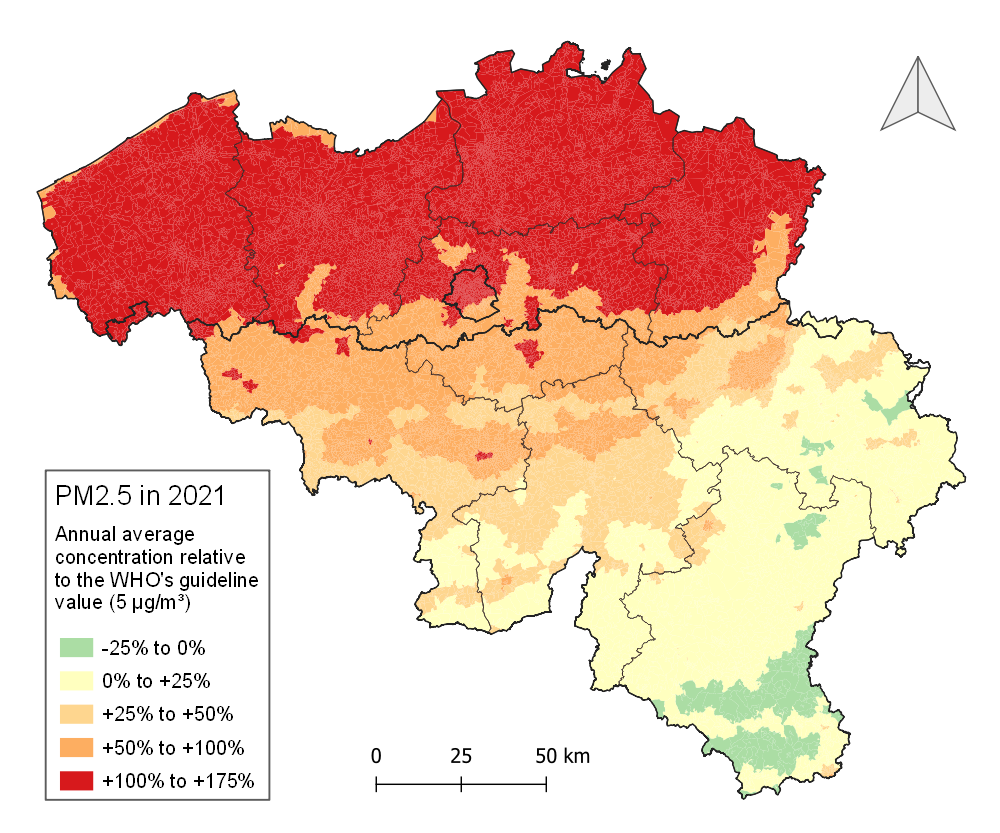
Relative concentration of PM10 per statistical sector in Belgium, 2021
Source: Own calculations based on air pollution data provided by IRCEL-CELINE [17].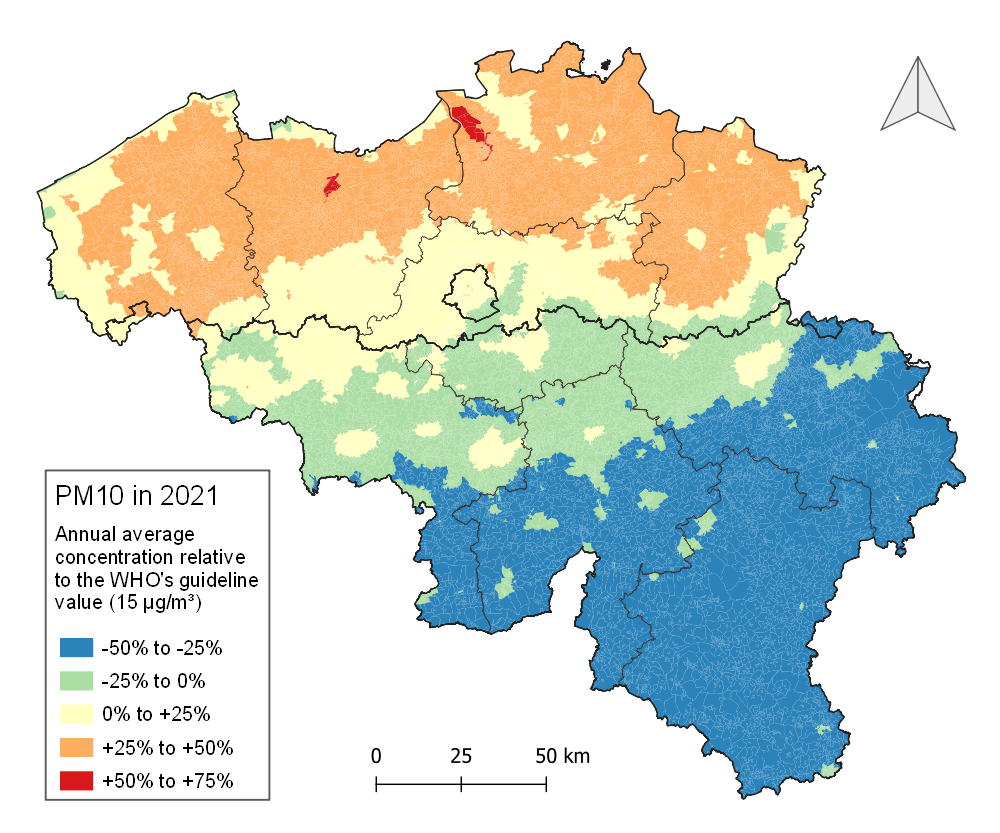
Population exposure to particulate matter in Belgium is high but decreasing
Population exposure to PM can be summarised by a population-weighted average concentration and is used to compare regions and explore trends in time. Exposure to both PM2.5 and PM10 is decreasing in Belgium, and within all regions. Exposure to PM was initially highest in the Brussels Capital Region, but dropped below the Flemish Region to converge with the average value for Belgium. Exposure to PM has consistently been lowest in the Walloon Region.
Although air quality improved over the past decade, many Belgians are still confronted with unhealthy levels of PM exposure. In 2021, while about three quarters of the population was exposed to pollution levels exceeding the long-term WHO guideline value for PM10, virtually the entire population breathes levels above the air quality guideline for PM2.5.
- PM2.5
- PM10
Belgium has the fourth highest exposure to particulate matter compared to similar EU countries
Belgium has the fourth highest population-weighted concentration for both PM2.5 and PM10, compared to the other EU-14 countries. Although well below some countries, exposure to PM is higher in Belgium than the European average, and twice as high as in Finland [19].
- PM2.5
- PM10
PM2.5 population-weighted average concentration (µg m-3), 2019
Source: Own calculations based on air pollution exposure data provided by the European Environment Agency [19].
PM10 population-weighted average concentration (µg m-3), 2019
Source: Own calculations based on air pollution exposure data provided by the European Environment Agency [19].
3. Nitrogen dioxide
Nitrogen oxides (NOX), including nitrogen monoxide (NO) and nitrogen dioxide (NO2), are gases formed and emitted together as a result of combustion, which occurs in car engines and power plants. NO is mostly harmless at the amounts present in the atmosphere, while ambient NO2 concentration can reach a point where it poses a serious health hazard.
Road traffic is by far the leading source of nitrogen dioxide emissions
Transport is the leading source of NOx emissions, including NO2, with road traffic by far the largest contributor, followed by shipping (both maritime and inland) and air traffic [1]. The severity of NO2 exposure as a result of road traffic is further increased due to emissions occurring near surface level and often in densely inhabited areas, and because of street canyons, where the pollutant gets trapped in narrow roads flanked by tall buildings [20]. Other, less significant sources include industry and agriculture.
Exposure to nitrogen dioxide can cause cardiovascular and respiratory diseases and lung cancer
NO2 is highly inflammatory and inhaling the gas can irritate the airways in the respiratory tract.
It is well established that prolonged exposure to NO2 can cause respiratory diseases, including emphysema, chronic bronchitis and pneumonia [21]. Research also points to a relationship with cardiovascular disease, and more specifically with ischemic heart disease [22,23]. Other well-studied effects include lung cancer and type 2 diabetes [24,25]. Studies suggest that NO2 can adversely affect mental health, showing an increased risk of depression [9,26]. These conditions can lead to a substantial loss of life quality and premature death [21].
NO2 threatens the health of women and their infants as exposure is associated with perinatal conditions, including preterm birth and low birth weight [27,28]. Children too are disproportionally affected as NO2 is linked to the development of asthma, and can also trigger asthma attacks resulting in more emergency department visits and hospitalisation [3,29].
Higher nitrogen dioxide concentrations in cities compared to rural areas
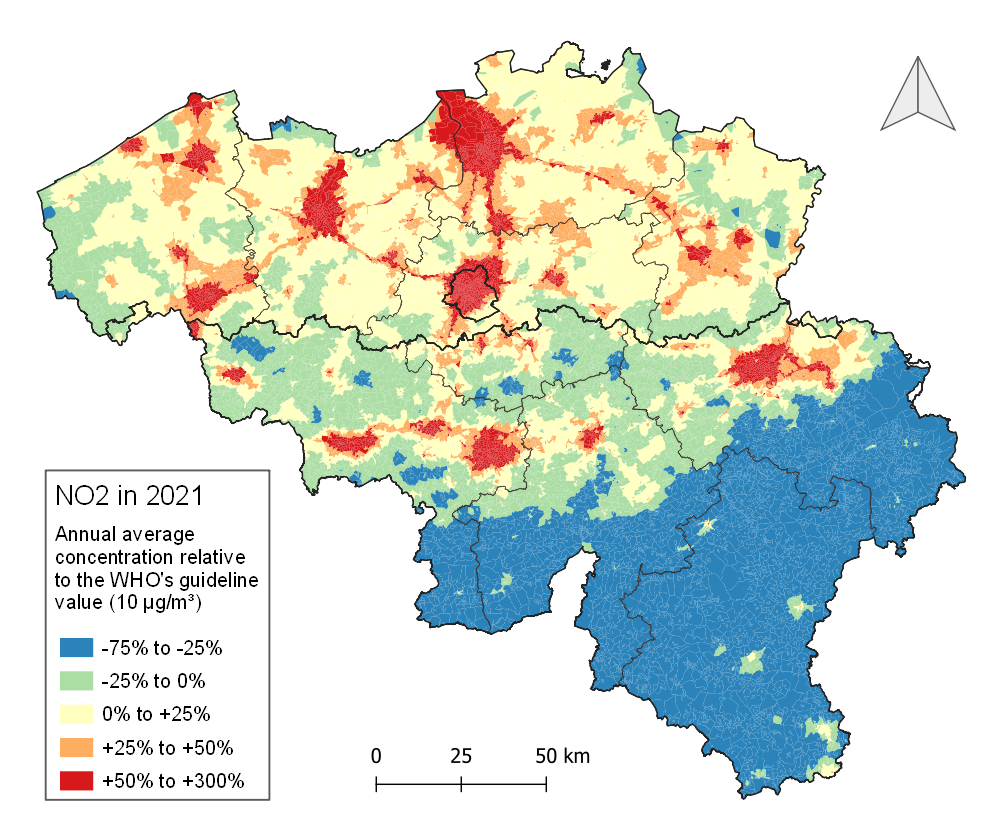
To visualise exposure to NO2 in Belgium, yearly average concentrations are mapped for each statistical sector. The values are shown relative to the WHO’s air quality guideline level for the pollutant, as an indication of exposure in the local community compared to the advised value: 10 µg m-3 annual average concentration [16].
As evidenced by the pollution map for NO2, concentrations are generally higher in the Flemish Region and the north of the Walloon Region, including the Sambre-Meuse region, as compared to the Ardennes. Road traffic being the principal source of NOx, the locations of large cities and major highways can be easily seen on the map. The Brussels Capital Region, a highly urbanised area, is severely polluted with the exception of the forested part in the southeast. About half of the sectors have pollution values above the long-term WHO guideline of 10 µg m-3 annual average concentration.
Source: Own calculations based on air pollution data provided by IRCEL-CELINE [17].
Population exposure to nitrogen dioxide in Belgium is high but decreasing
Population exposure to NO2 can be summarised by a population-weighted average concentration, and used to compare regions and explore trends over time. Exposure to NO2 is decreasing in Belgium, and within all regions. Exposure to NO2 is highest in the Brussels Capital Region, although the decline in pollution levels is somewhat steeper there compared to the other regions. Exposure to NO2 is consistently lowest in the Walloon region, while Flemish levels stay close to the Belgian average.
Although the trends are favourable, there is still room for improvement. Considering the most recent figures for 2021, more than 85% of the population is exposed to unhealthy levels of NO2, exceeding the WHO’s long-term guideline value.
Source: Own calculations based on air pollution data provided by IRCEL-CELINE [17], and population data provided by Statbel [18].
Belgium has the fifth highest exposure to nitrogen dioxide compared to similar EU countries
Belgium has the fifth highest population-weighted concentration for NO2 compared to the other EU-14 countries, well above the average European concentration. Exposure levels are more than double the values of Nordic countries Denmark, Finland, and Sweden [19].
Source: Own calculations based on air pollution exposure data provided by the European Environment Agency [19].
4. Ozone
Ozone (O3) is a gas formed from oxygen (O2) by the action of ultra-violet radiation or lightning. It exists in all layers of the atmosphere in various concentrations. Although its presence in the stratosphere, tens of kilometres high, protects lifeforms against the most damaging solar radiation, ground-level ozone poses a serious threat to health.
Ozone levels are higher during summer, especially on sunny days
O3 in the lower atmosphere originates from chemical reactions under the influence of sunlight. It is formed from precursors, including nitrogen oxides, methane, and volatile organic compounds (VOCs). VOCs know many industrial applications, and this sector is responsible for the largest share of emissions in Belgium. Other major sources are agriculture, most notably livestock, and road traffic [1].
O3 concentration is strongly dependent on weather, season, the time of the day, and emissions of precursors. On a short time scale, there will be more O3 during daytime and on sunny days. Over the year, O3 concentrations are higher in the summer, with the peak ozone season ranging from April to September in Belgium. O3 reacts with NO to form O2 and NO2; the reverse reaction is also possible where O2 and NO2 react to form O3. As a result, locations with high NO concentrations, such as cities and busy roads, generally have lower O3 pollution [30].
Ozone peaks cause respiratory problems and can result in death
Ozone is a highly reactive and oxidative gas, which makes it harmful to both humans and ecosystems. Peak O3 concentrations have been linked to a wide range of respiratory problems. Short-term exposure is associated with symptoms including coughing and wheezing, as well as asthma attacks and, in extreme cases, death [29,31].
Ozone affects individuals of every age group. Indeed, ambient O3 poses a threat to mothers and their infants as exposure during pregnancy is associated with low birth weight, preterm birth, and stillbirth [27,28,32]. Prolonged exposure can lead to decreased lung function in children [33]. O3 also impacts the elderly as they are more sensitive to its adverse effects compared to the general population [34].
Rural areas have higher ozone concentrations compared to cities
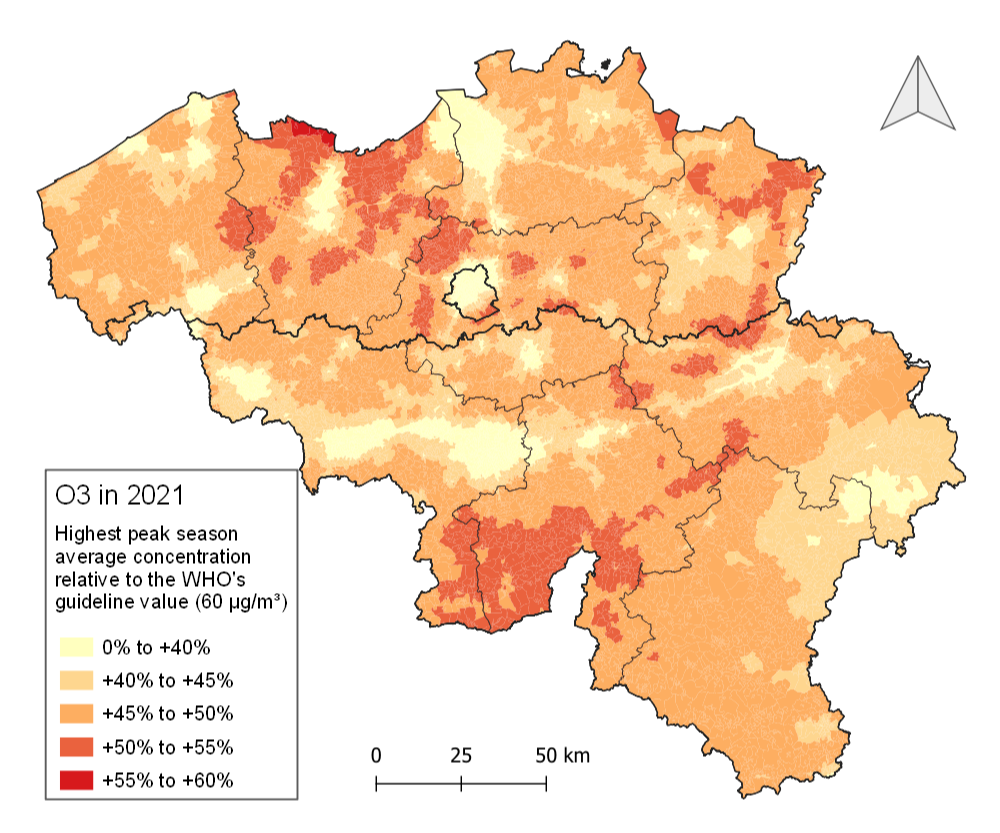
To visualise exposure to O3 in Belgium, peak season concentrations are mapped for each statistical sector. The values are shown relative to the WHO’s air quality guideline level for the pollutant as an indication of exposure in the local community compared to the advised value: 60 µg m-3 peak season average [16]. Because of its seasonal and diurnal character, the WHO guidelines for O3 are based on a peak metric: the daily maximum 8-hour mean concentration averaged over the peak ozone season. This amounts to only daytime levels being taken into consideration and is limited to the summer season.
As evidenced by the pollution map for O3, concentrations are generally higher in the Walloon Region compared to the Flemish Region and the Brussels Capital Region. The spatial pattern of O3 appears to a large extent to be the inverse of the pattern of NO2. The likely explanation is that the NO emitted together with NO2 by cars and other vehicles breaks down ozone in traffic-busy areas. The result is that urban centres and the surroundings of highways experience lower concentrations compared to rural areas. Despite this urban-rural distinction, virtually the entire territory has long-term O3 concentrations exceeding the WHO-recommended value.
Source: Own calculations based on air pollution data provided by IRCEL-CELINE [17].
Exposure to ozone has been steadily increasing over time in Belgium
Population exposure to O3 can be summarised by a population-weighted average concentration and used to compare regions, and explore trends in time. Contrary to the other pollutants, exposure to O3 in Belgium and its regions is rising. Considering the most recent figures for the year 2021, exposure in the Flemish Region is comparable to the Belgian average, while it is slightly higher in the Walloon Region and significantly lower in the Brussels Capital Region. Despite these regional differences, the entirety of the Belgian population is exposed to O3 concentrations that exceed the WHO’s recommended value.
Source: Own calculations based on air pollution data provided by IRCEL-CELINE [17], and population data provided by Statbel [18].
Belgium has the sixth lowest exposure to ozone compared to similar EU countries
The European comparison of ozone exposure is not based on the average concentration, as is the case for the WHO’s guideline value, but on a metric called SOMO35: the sum of means (daily maximum 8-hour) over 35 ppb. As this is a cumulative figure, the values can become high as compared to metrics based on averages.
Belgium has the sixth lowest population-weighted SOMO35 for O3 compared to the other EU-14 countries, well below the average European concentration [19].
Source: Own calculations based on air pollution exposure data provided by the European Environment Agency [19].
5. Read more
View the metadata for this indicator
Background
Poor air quality constitutes the single biggest environmental health risk worldwide, responsible for millions of premature deaths and healthy life years lost. Exposure to air pollution has been associated with respiratory diseases, cardiovascular disorders, lung cancer, and diabetes, as well as perinatal, neurological and mental health effects. It disproportionally affects vulnerable groups, including women and their infants, children, the elderly and people with lung diseases and asthma. This page provides an overview of the exposure of Belgians to particulate matter, nitrogen dioxide, and ozone, pollutants that are considered to have a major health impact [16].
To improve air quality and protect and promote public health, the WHO publishes the Air Quality Guidelines, which are a set of recommended limit values for specific air pollutants. The guidelines were last updated with recent scientific evidence in 2021, and contain recommendations for daily concentrations as well as long-term averages. Aside from the WHO’s advised values, the European Union enforces legally binding air quality standards. The EU standards are less stringent than the corresponding WHO guidelines, as these are the result of political negotiations, and consider health as well as economic feasibility [16,35].
The air pollutants addressed in this sheet are particulate matter with diameters <2.5 µm and <10 µm (PM2.5 and PM10), nitrogen dioxide (NO2), and ozone (O3). Air quality assessment is based on pollution maps provided by IRCEL-CELINE, which depict the yearly average concentration for each location in Belgium. The pollution maps are the result of models, which are verified against actual measurements but are still subject to a degree of error. The population data used are provided by Statbel [17,18].
Definitions
- Concentration, emissions and deposition
-
The quality of air is determined by the concentration of air pollutants. This concentration is commonly expressed in the form of mass concentration, giving you the mass of a polluting substance present in a volume of air. As this mass is usually very small compared to the space it occupies, a common unit is microgram per cubic meter (µg m-3; a microgram is equal to 1 millionth of a gram).
The concentration of air pollutants is dependent on (direct or indirect) emissions and deposition. Sources either emit pollution directly or emit substances that turn into pollution (called precursors), in both cases leading to an increase in concentration. Deposition is the removal of pollution, where the pollutant settles on the earth’s surface or is washed out by rain, improving air quality. Emissions and deposition are commonly expressed as rates, for instance as kilogram per hour or tonne per year [36].
- Population exposure
-
The exposure of people to ambient air pollution can be determined by linking their place of residence to outdoor concentrations of pollution. Exposure in local communities is approached here as the average pollutant concentration in their neighbourhood, in this case defined by the statistical sector. As these sectors are the smallest geographical unit in Belgium, and given that internal differences are limited, such a simple average can be considered representative of all inhabitants.
To measure population exposure on a national or regional scale, a population-weighted average concentration is derived. In the calculation, the population number at each location is taken into account as the weight for the corresponding concentration level. For large areas, this is preferred over a simple average concentration, as this value can be biased in case its inhabitants tend to live in the more or the less polluted parts.
References
- European Environment Agency. National Air Pollutant Emissions Data Viewer 2005-2021, 2023. https://www.eea.europa.eu/data-and-maps/dashboards/necd-directive-data-viewer-7.
- OECD. Mortality Risk Valuation in Environment, Health and Transport Policies, 2012. https://doi.org/10.1787/9789264130807-en.
- EMEP Centre on Emission Inventories and Projections. Data Viewer – Reported Emissions Data, 2023. https://www.ceip.at/data-viewer-2.
- Chen, J.; Hoek, G. Long-Term Exposure to PM and All-Cause and Cause-Specific Mortality: A Systematic Review and Meta-Analysis, 2020. https://doi.org/10.1016/j.envint.2020.105974.
- Park, J.; Kim, H.-J.; Lee, C.-H.; Lee, C. H.; Lee, H. W. Impact of Long-Term Exposure to Ambient Air Pollution on the Incidence of Chronic Obstructive Pulmonary Disease: A Systematic Review and Meta-Analysis, 2021. https://doi.org/10.1016/j.envres.2020.110703.
- Alexeeff, S. E.; Liao, N. S.; Liu, X.; Van Den Eeden, S. K.; Sidney, S. Long‐Term PM2.5 Exposure and Risks of Ischemic Heart Disease and Stroke Events: Review and Meta‐Analysis, 2021. https://doi.org/10.1161/JAHA.120.016890.
- Ciabattini, M.; Rizzello, E.; Lucaroni, F.; Palombi, L.; Boffetta, P. Systematic Review and Meta-Analysis of Recent High-Quality Studies on Exposure to Particulate Matter and Risk of Lung Cancer, 2021. https://doi.org/10.1016/j.envres.2020.110440.
- Yang, Z.; Wang, Q.; Liu, P. Extreme Temperature and Mortality: Evidence from China, 2019. https://doi.org/10.1007/s00484-018-1635-y.
- Borroni, E.; Pesatori, A. C.; Bollati, V.; Buoli, M.; Carugno, M. Air Pollution Exposure and Depression: A Comprehensive Updated Systematic Review and Meta-Analysis, 2022. https://doi.org/10.1016/j.envpol.2021.118245.
- Yu, Z.; Zhang, X.; Zhang, J.; Feng, Y.; Zhang, H.; Wan, Z.; Xiao, C.; Zhang, H.; Wang, Q.; Huang, C. Gestational Exposure to Ambient Particulate Matter and Preterm Birth: An Updated Systematic Review and Meta-Analysis, 2022. https://doi.org/10.1016/j.envres.2022.113381
- Ghosh, R.; Causey, K.; Burkart, K.; Wozniak, S.; Cohen, A.; Brauer, M. Ambient and Household PM2.5 Pollution and Adverse Perinatal Outcomes: A Meta-Regression and Analysis of Attributable Global Burden for 204 Countries and Territories, 2021. https://doi.org/10.1371/journal.pmed.1003718.
- Zhu, W.; Zheng, H.; Liu, J.; Cai, J.; Wang, G.; Li, Y.; Shen, H.; Yang, J.; Wang, X.; Wu, J.; Nie, J. The Correlation between Chronic Exposure to Particulate Matter and Spontaneous Abortion: A Meta-Analysis, 2022. https://doi.org/10.1016/j.chemosphere.2021.131802.
- Khreis, H.; Kelly, C.; Tate, J.; Parslow, R.; Lucas, K.; Nieuwenhuijsen, M. Exposure to Traffic-Related Air Pollution and Risk of Development of Childhood Asthma: A Systematic Review and Meta-Analysis, 2017. https://doi.org/10.1016/j.envint.2016.11.012.
- Lim, H.; Kwon, H.-J.; Lim, J.-A.; Choi, J. H.; Ha, M.; Hwang, S.-S.; Choi, W.-J. Short-Term Effect of Fine Particulate Matter on Children’s Hospital Admissions and Emergency Department Visits for Asthma: A Systematic Review and Meta-Analysis, 2016. https://doi.org/10.3961/jpmph.16.037.
- Lin, L.-Z.; Zhan, X.-L.; Jin, C.-Y.; Liang, J.-H.; Jing, J.; Dong, G.-H. The Epidemiological Evidence Linking Exposure to Ambient Particulate Matter with Neurodevelopmental Disorders: A Systematic Review and Meta-Analysis, 2022. https://doi.org/10.1016/j.envres.2022.112876.
- World Health Organization. WHO Global Air Quality Guidelines: Particulate Matter (PM2.5 and PM10), Ozone, Nitrogen Dioxide, Sulfur Dioxide and Carbon Monoxide, 2021. https://www.who.int/publications/i/item/9789240034228.
- IRCEL-CELINE. Air Quality Models. https://www.irceline.be/en/documentation/models.
- Statbel. Bevolking per Statistische Sector. https://statbel.fgov.be/nl/open-data/bevolking-statistische-sector-9.
- European Environment Agency. Air Quality Health Risk Assessments (NUTS3). https://www.eea.europa.eu/ds_resolveuid/45d9e01d512d44528cf6b933809883e5.
- Fierens, F.; Vanpoucke, C.; Trimpeneers, E.; Dumoulin, R.; Maetz, P.; Hutsemékers, V.; Degrave, C. Jaarrapport Luchtkwaliteit in België 2022, 2023. https://www.irceline.be/nl/documentatie/publicaties/jaarrapporten/jaarrapport-luchtkwaliteit-in-belgie-2022/view.
- Huangfu, P.; Atkinson, R. Long-Term Exposure to NO2 and O3 and All-Cause and Respiratory Mortality: A Systematic Review and Meta-Analysis, 2020. https://doi.org/10.1016/j.envint.2020.105998.
- Huang, S.; Li, H.; Wang, M.; Qian, Y.; Steenland, K.; Caudle, W. M.; Liu, Y.; Sarnat, J.; Papatheodorou, S.; Shi, L. Long-Term Exposure to Nitrogen Dioxide and Mortality: A Systematic Review and Meta-Analysis, 2021. https://doi.org/10.1016/j.scitotenv.2021.145968.
- Stieb, D. M.; Zheng, C.; Salama, D.; Berjawi, R.; Emode, M.; Hocking, R.; Lyrette, N.; Matz, C.; Lavigne, E.; Shin, H. H. Systematic Review and Meta-Analysis of Case-Crossover and Time-Series Studies of Short Term Outdoor Nitrogen Dioxide Exposure and Ischemic Heart Disease Morbidity, 2020. https://doi.org/10.1186/s12940-020-00601-1.
- Stieb, D. M.; Berjawi, R.; Emode, M.; Zheng, C.; Salama, D.; Hocking, R.; Lyrette, N.; Matz, C.; Lavigne, E.; Shin, H. H. Systematic Review and Meta-Analysis of Cohort Studies of Long Term Outdoor Nitrogen Dioxide Exposure and Mortality, 2021. https://doi.org/10.1371/journal.pone.0246451.
- Yang, B.-Y.; Fan, S.; Thiering, E.; Seissler, J.; Nowak, D.; Dong, G.-H.; Heinrich, J. Ambient Air Pollution and Diabetes: A Systematic Review and Meta-Analysis, 2020. https://doi.org/10.1016/j.envres.2019.108817.
- Fan, S.-J.; Heinrich, J.; Bloom, M. S.; Zhao, T.-Y.; Shi, T.-X.; Feng, W.-R.; Sun, Y.; Shen, J.-C.; Yang, Z.-C.; Yang, B.-Y.; Dong, G.-H. Ambient Air Pollution and Depression: A Systematic Review with Meta-Analysis up to 2019, 2020. https://doi.org/10.1016/j.scitotenv.2019.134721.
- Ju, L.; Li, C.; Yang, M.; Sun, S.; Zhang, Q.; Cao, J.; Ding, R. Maternal Air Pollution Exposure Increases the Risk of Preterm Birth: Evidence from the Meta-Analysis of Cohort Studies, 2021. https://doi.org/10.1016/j.envres.2021.111654.
- Li, C.; Yang, M.; Zhu, Z.; Sun, S.; Zhang, Q.; Cao, J.; Ding, R. Maternal Exposure to Air Pollution and the Risk of Low Birth Weight: A Meta-Analysis of Cohort Studies, 2020. https://doi.org/10.1016/j.envres.2020.109970.
- Orellano, P.; Quaranta, N.; Reynoso, J.; Balbi, B.; Vasquez, J. Effect of Outdoor Air Pollution on Asthma Exacerbations in Children and Adults: Systematic Review and Multilevel Meta-Analysis, 2017. https://doi.org/10.1371/journal.pone.0174050.
- Monks, P. S.; Archibald, A. T.; Colette, A.; Cooper, O.; Coyle, M.; Derwent, R.; Fowler, D.; Granier, C.; Law, K. S.; Mills, G. E.; Stevenson, D. S.; Tarasova, O.; Thouret, V.; von Schneidemesser, E.; Sommariva, R.; Wild, O.; Williams, M. L. Tropospheric Ozone and Its Precursors from the Urban to the Global Scale from Air Quality to Short-Lived Climate Forcer, 2015. https://doi.org/10.5194/acp-15-8889-2015.
- Orellano, P.; Reynoso, J.; Quaranta, N.; Bardach, A.; Ciapponi, A. Short-Term Exposure to Particulate Matter (PM10 and PM2.5), Nitrogen Dioxide (NO2), and Ozone (O3) and All-Cause and Cause-Specific Mortality: Systematic Review and Meta-Analysis, 2020. https://doi.org/10.1016/j.envint.2020.105876.
- Zhang, H.; Zhang, X.; Wang, Q.; Xu, Y.; Feng, Y.; Yu, Z.; Huang, C. Ambient Air Pollution and Stillbirth: An Updated Systematic Review and Meta-Analysis of Epidemiological Studies, 2021. https://doi.org/10.1016/j.envpol.2021.116752.
- Holm, S. M.; Balmes, J. R. Systematic Review of Ozone Effects on Human Lung Function, 2013 Through 2020, 2022. https://doi.org/10.1016/j.chest.2021.07.2170.
- Bell, M. L.; Zanobetti, A.; Dominici, F. Who Is More Affected by Ozone Pollution? A Systematic Review and Meta-Analysis, 2014. https://doi.org/10.1093/aje/kwu115.
- European Commission. EU Air Quality Standards. https://environment.ec.europa.eu/topics/air/air-quality/eu-air-quality-standards_en.
- IRCEL-CELINE. What Is the Difference between Emission, Concentration, Exposure and Deposition? https://www.irceline.be/en/documentation/faq/what-is-the-difference-between-emission-concentration-exposure-and-deposition.
Please cite this page as: Sciensano. Determinants of Health: Air quality, Health Status Report, 25 Mar 2024, Brussels, Belgium, https://www.healthybelgium.be/en/health-status/determinants-of-health/air-quality