Key figures
On this table, when a statistical test has been performed, the data showing a significant difference is displayed on a yellow background, otherwise on a grey background.
The geographical dispersion marker Δ shows the result of comparing the coefficient of variation (CV) of the indicator with the median (MED) of the CVs of all analyses for this indicator: δ if CV > MED + 10%, δδ if CV > MED + 20%, δδδ if CV > MED + 30% (Exception: For median age, δ means CV > MED + 30%).
Data
NIHDI nomenclature codes selected for analysis
| CODES | LABEL | CREATION | DELETION |
| 162470-162481 | Tuteur bronchique ou pulmonaire en matière synthétique, par tuteur | 01/07/2014 | |
| 162492-162503 | Tuteur bronchique ou pulmonaire auto-expansible en matière synthétique, par tuteur | 01/07/2014 | |
| 162514-162525 | Tuteur bronchique ou pulmonaire auto-expansible en métal, par tuteur | 01/07/2014 | |
| 162536-162540 | Tuteur trachéo-bronchique en Y en matière synthétique, par tuteur | 01/07/2014 | |
| 162551-162562 | Brosse de cytologie et/ou pince à biopsie utilisée lors d'une des prestations 471715-471726 ou 471730-471741 de la nomenclature | 01/07/2014 | |
| 162573-162584 | Ensemble du matériel de consommation utilisé lors de la prestation 471855-471866 de la nomenclature | 01/07/2014 | |
| 180773-180784 | Ensemble de matériel pour la quantification de la ventilation collatérale dans des compartiments pulmonaires isolés, utilisé lors d'une bronchoscopie diagnostique | 01/02/2020 | |
| 180795-180806 | Valve endobronchique unidirectionnelle avec système de placement | 01/02/2020 | |
| 257272-257283 | Bronchoscopie avec extraction de corps étrangers | 01/04/1985 | |
| 257294-257305 | Bronchoscopie sans prélèvement biopsique, et/ou bronchoscopie avec aspiration thérapeutique | 01/04/1985 | |
| 257316-257320 | Bronchoscopie avec prélèvement biopsique, et/ou ablation de tumeurs, et/ou coagulation de lésions | 01/04/1985 | |
| 471715-471726 | Bronchoscopie sans prélèvement biopsique, y compris un mini lavage (< 100 ml) éventuel | 01/04/1985 | |
| 471730-471741 | Bronchoscopie avec biopsie au niveau des voies aériennes centrales, y compris un mini lavage (< 100 ml) éventuel | 01/04/1985 | |
| 471752-471763 | Bronchoscopie avec ponction transcarinale et contrôle radioscopique éventuel | 01/04/1985 | |
| 471774-471785 | Bronchoscopie avec lavage broncho-alvéolaire (minimum 100 ml) | 01/04/1985 | |
| 471796-471800 | Bronchoscopie avec extraction d'une valve endobronchique, d'un stent ou d'un autre corps étranger | 01/04/1985 | |
| 471811-471822 | Bronchoscopie avec prélèvement de biopsies pulmonaires périphériques (y compris une radioscopie éventuelle) sans utilisation de techniques de navigation | 01/04/1985 | |
| 471833-471844 | Echoendoscopie bronchique | 01/03/2009 | |
| 471855-471866 | Echo-endoscopie bronchique avec ponction de tissu extramural (matériel disposable non compris) | 01/03/2009 | |
| 471870-471881 | Bronchoscopie avec débulking des voies aériennes centrales | 01/05/2024 | |
| 471892-471903 | Bronchoscopie avec placement d'un stent ou d'une valve endobronchique ou d’un clip endobronchique | 01/05/2024 | |
| 471914-471925 | Bronchoscopie avec prélèvement de biopsies pulmonaires périphériques (y compris une radioscopie éventuelle) avec utilisation d’une navigation guidée par ultrasons ou d’une navigation électromagnétique | 01/05/2024 | |
| 471936-471940 | Bronchoscopie avec dilatation des voies aériennes centrales au moyen d’un bronchoscope rigide ou d’une dilatation par ballonnet, y compris une biopsie éventuelle | 01/05/2024 | |
| 699252-699263 | Tuteur bronchique ou pulmonaire en matière synthétique , par tuteur | 01/11/2005 | 30/06/2014 |
| 699274-699285 | Tuteur bronchique ou pulmonaire auto-expansible en matière synthétique , par tuteur | 01/11/2005 | 30/06/2014 |
| 699296-699300 | Tuteur bronchique ou pulmonaire auto-expansible en métal, par tuteur | 01/11/2005 | 30/06/2014 |
| 699893-699904 | Tuteur trachéo-bronchique en Y en matière synthétique, par tuteur | 01/06/2009 | 30/06/2014 |
| 733250-733261 | Brosse de cytologie et/ou pince à biopsie utilisée lors d'une des prestations 471715-471726 ou 471730-471741 | 01/03/2005 | 30/06/2014 |
| 733294-733305 | Ensemble du matériel de consommation utilisé lors de la prestation 471855-471866 | 01/03/2009 | 30/06/2014 |
The codes mentioned above can be used in rates and expenses, or only in expenses. We invite you to consult the full report for more information.
Below is a graph showing the evolution of the breakdown by volume of nomenclature codes used for the rates:
")
Population selection
No selection
Analysis period
2024
Graphics
 Nomenclature codes
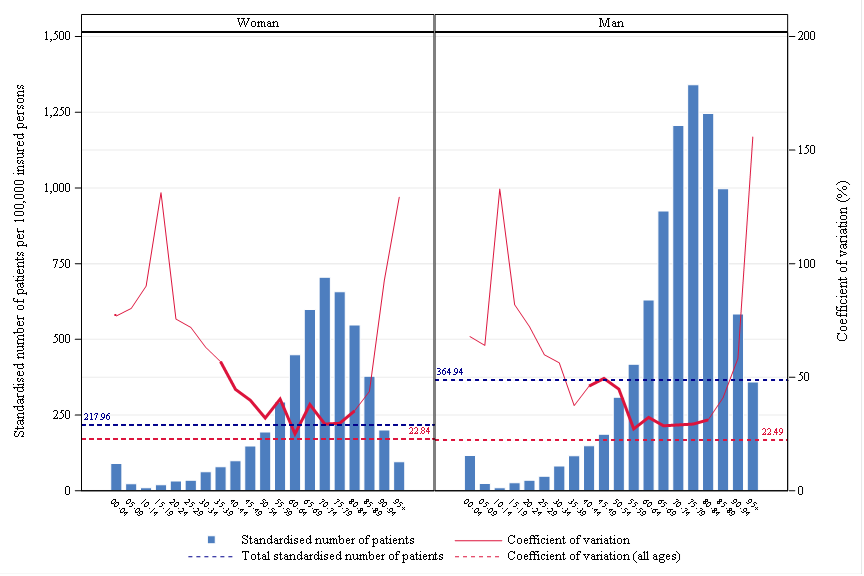
 Age, gender and CV
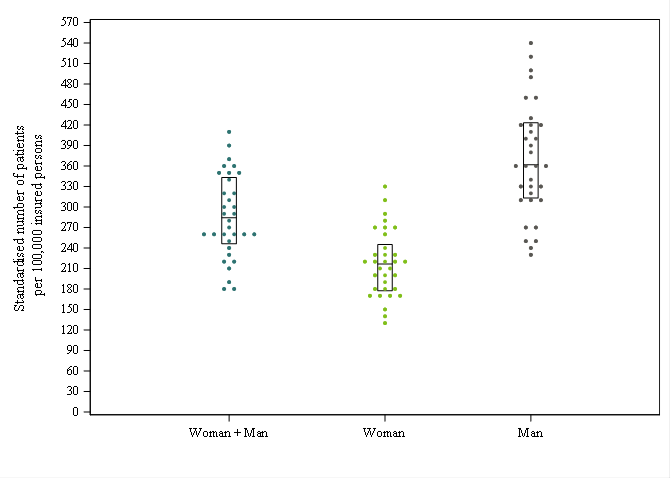
 Rates by sex
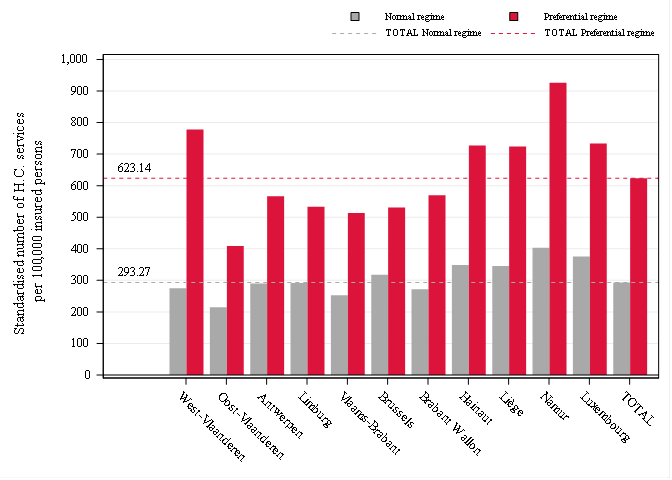
 Reimbursement rate
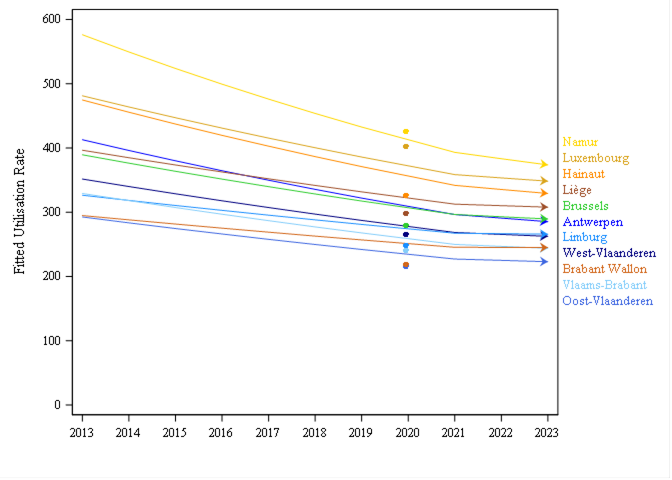
 Trends by region
 Trends break
 Dot Plot
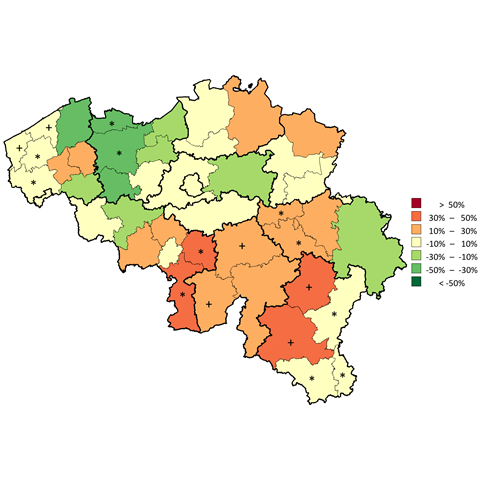
 Distribution map
 Expenses Distribution map
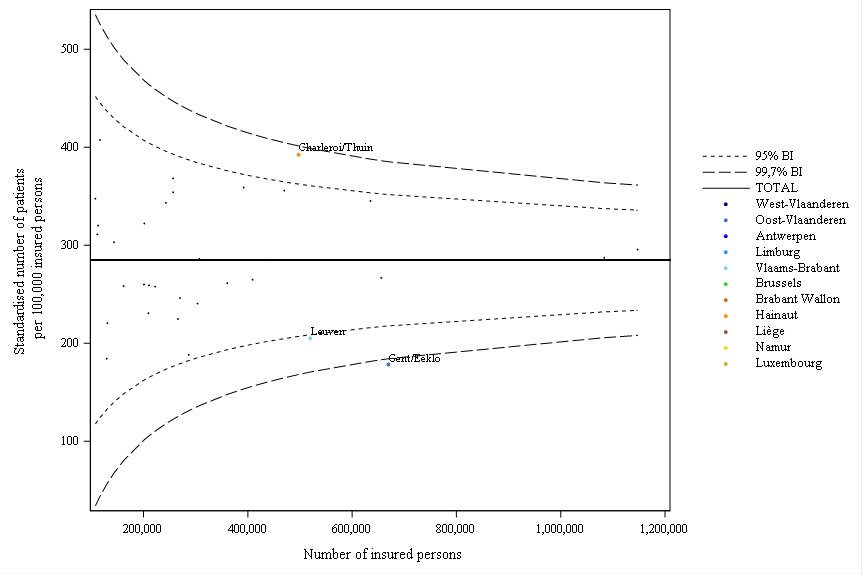
 Funnel plot
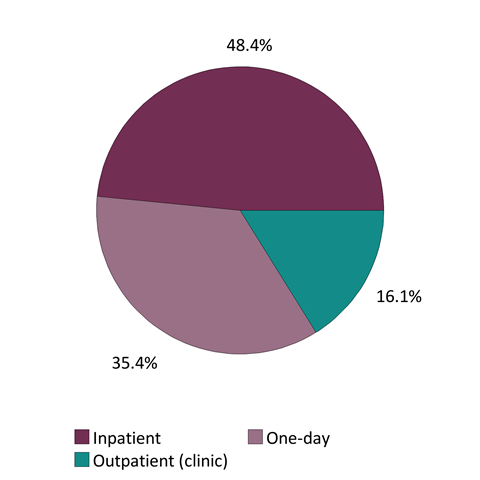
 Patient care settings
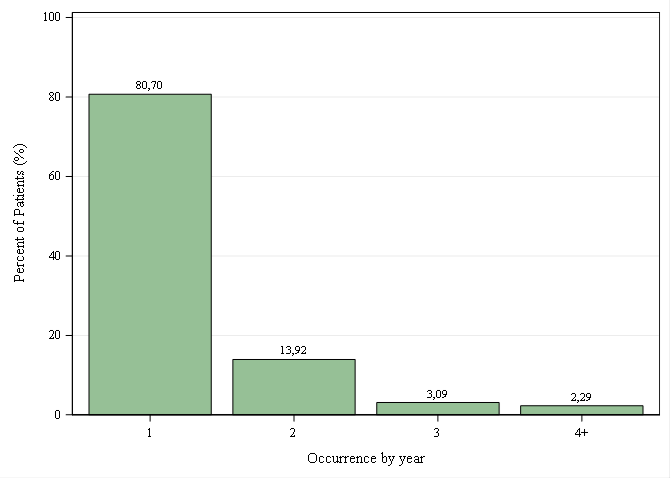
 Occurrences per year
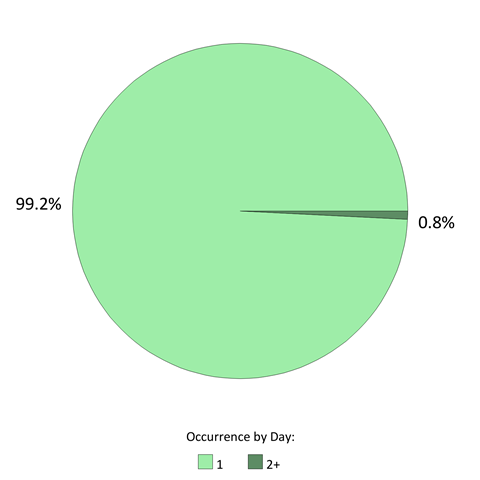
 Occurrences per day


Comments
WE ARE INTERESTED IN YOUR OPINION
Do you have any experience in this area ? We listen to you !