Appropriateness of care can be defined as the degree to which provided healthcare is relevant to the medical needs of the patient, given the current best evidence. It can be assessed through various approaches. One of the most reliable is to assess how well medical practice follows recommendations from clinical guidelines. Another frequently used method is to examine how much medical practice varies across geographical areas.
Eight indicators relating to acute and chronic care have been selected for this section. Most of them examine the compliance with guidelines for a selection of healthcare services:
- Follow-up of diabetic patients (QA-1, QA-2)
- Prescription of antibiotics (QA-3 to QA-5)
- Medical imaging of the spine (QA-6)
- Adjuvant treatment after surgery for testicular cancer (QA-9)
A last indicator relates to the geographical variability of caesarean section rates (QA-8), and has been moved from the “Mother and newborn care” section (formerly MN-3).
Other indicators relating more or less closely to the appropriateness of care can be found in other sections of this website:
- Under preventive care, the indicators on vaccination and screening (P-1 to P-4, P-6 to P-9, P-12 and P-14);
- Under mental health care, the indicators on drug prescription and consumption (MH-6 to MH-8);
- Under care for older people, the indicators on drug prescription and consumption (OLD-10 to OLD-12);
- Under end-of-life care, the indicators on the timely initiation of palliative care and the aggressiveness of care at the end of life (EOL-2 and EOL-3);
- Under mother and newborn care, the indicators on the number of antenatal consultations for low-risk pregnancies (MN-10), repeated toxoplasmosis C screening during pregnancy (MN-8), induction rate (MN-4), proportion of vaginal births following a previous C-section (MN-6), episiotomy rate (MN-5), very preterm births in hospital without NICU (neonatal intensive care unit, MN-7), Number of newborn screening tests performed outside the required deadlines (“heel-stick” test) (a sub-indicator of MN-9);
- Finally, more information on medical practice variations can be found in the dedicated section of the website.
a Appropriate follow-up is defined as patients receiving regular retinal exams and blood tests (glycohemoglobin, serum creatinin , lipid profile and microalbuminuria); b Antibiotics of second intention are: amoxicillin with clavulanic acid, macrolides, cephalosporins and quinolones.


Appropriate follow-up of diabetes in patients aged 18 years or over (QA-1, QA-2)
Diabetes is a chronic (long-term) disease that occurs when the body is unable to regulate excessive levels of glucose (sugar). There are two main types. Type 1 diabetes is an auto-immune disease characterised by a malfunction of the pancreas, which becomes unable to produce insulin, the hormone that lowers blood sugar levels. It makes up 5-10% of all diabetes cases. Patients with type 2 diabetes typically do still produce insulin, but either this production is too low, or their body responds to it insufficiently (“insulin resistance”). Type 2 is by far the most common form of diabetes and is linked to various factors, including but not limited to a genetic susceptibility, overweight or obesity, a lack of exercise, etc.
In Belgium, this condition is becoming more common over time. In 2021, 6.8% of the population was living with a diagnosed diabetes. However, as mentioned in the section on the health status of the population, more than one in three people with diabetes do not know they have the disease, which means it is actually likely to affect about 10% of the population.
If left undiagnosed, untreated or poorly controlled, diabetes can result in serious complications, including blindness, kidney failure or amputation of a toe, foot or leg due to chronic wounds. Diabetes also increases the risk of cardiovascular diseases.
Type 1 diabetes requires a treatment with insulin. Type 2 diabetes does not always require a treatment beyond lifestyle measures; when it is necessary, the treatment may or may not include insulin, but the majority of patients do not receive insulin.
Regular monitoring of a number of parameters and potential complications is recommended in all diabetes patients. For these indicators, we have examined the percentage of people living with diabetes who have received five specific tests in the past 15 months (HbA1c twice, cholesterol, microalbuminuria, serum creatinine, and follow-up by an ophthalmologist) to assess the appropriateness of their follow-up. Results are available separately for patients receiving insulin (QA-1) and patients receiving other glucose-lowering drugs (QA-2), but no insulin.
It is worth noting, however, that some recent guidelines do not recommend all five tests in all patients living with diabetes, or recommend them less frequently. Therefore, it is important to also consider results per test.
Results
- All five tests selected to assess the quality of diabetes follow-up were performed in 42.7% of adults living with diabetes and receiving insulin in 2021 (and in 43,1% in 2020); this is less than during the 2011-2019 period, where this percentage was close to 50%.
- For patients receiving glucose-lowering drugs other than insulin, this percentage was much lower, 17.2% in 2020 and 16.9% in 2021. This is less than in 2019 (19.3%), but still an improvement compared to 2011 (14.1%).
- Regional differences are limited, with somewhat worse results for patients under insulin in Wallonia and somewhat better results for those receiving glucose-lowering drugs other than insulin in Brussels.
- For patients under insulin, there is a very good coverage for serum creatinine (96.6%), cholesterol (91.2%) and glycated haemoglobin (85.0%), while the annual consultations with an ophthalmologist (60.8%) and microalbuminuria testing (66.7%) are less frequent. However, those last three tests are not recommended every year for all patients in some recent guidelines.
- For patients receiving glucose-lowering drugs other than insulin, there is a good coverage for serum creatinine (93.6%), cholesterol (89.0%) and glycated haemoglobin (70.9%), while microalbuminuria tests and ophthalmological consultations are performed in less than half of the patient population every year. This low rate can be explained by the recommendations included in recent guidelines for the ophthalmological consultations, but less so for the follow-up of microalbuminuria, which is recommended yearly in all type 2 diabetes patients (which make up the bulk of the group without insulin treatment).
- The percentage of older people living in a residential care facility with appropriate diabetes follow-up is low, due to less frequent visits to the ophthalmologist. This raises questions about the coordination of care for this population.
Link to the technical sheet and detailed results
Data source: IMA - AIM
Prudent prescription of antibiotics (QA-3, QA-4, QA-5)
Antimicrobials are crucial drugs used to fight a whole range of infections caused by bacteria, viruses, moulds and other microscopic germs; the term “antibiotics” refers specifically to antimicrobials which target bacteria. Unfortunately, over time, a growing number of germs have evolved to become resistant to common antimicrobial treatments, which poses a major threat to public health. The main driver of this problem is non-prudent use of these medications – and particularly of antibiotics – in human and animal healthcare, as well as contamination of the environment. Therefore, it is essential to only use antibiotics when they are actually needed and effective, but also to carefully choose the most appropriate drug. For instance, some powerful antibiotics should only be used as second-line treatments, when a first-line antibiotic treatment has proved ineffective.
Various international initiatives have been set up to tackle antimicrobial resistance, with national strategies implemented in most countries. In Belgium, the Belgian Antibiotic Policy Coordination Committee (BAPCOC) has set several targets, e.g. to decrease total antibiotic use. Since 2018, the reimbursement of some powerful antibiotic drugs (“quinolones”) has also been restricted to very specific situations. An integrated and holistic “One Health” approach has also been launched in 2019 to tackle antimicrobial resistance across the medical, pharmaceutical and veterinary sectors.
This set of indicators examines the volume of antibiotics prescribed in ambulatory care (in number of daily doses per 1000 inhabitants and per day) (QA-3), the percentage of the population who has taken antibiotics at least once a year (QA-4) and the share of second-line antibiotic treatments in the total number of daily doses of antibiotics delivered (QA-5).
Results
Volume of antibiotics prescribed in ambulatory care (number of daily doses per 1000 inhabitants per day) (QA-3)
- In 2021, antibiotic consumption in the Belgian ambulatory sector amounted to 16.0 daily doses per 1000 inhabitants and per day. This is a substantial improvement compared to 2016 (22.5), but remains very high compared to other European countries (e.g. over twice as much as in the Netherlands (7.6)). Moreover, a particularly sharp drop was observed during the COVID-19 pandemic, with a slight rebound in 2021, and it is not impossible figures will get back to pre-pandemic levels in future.
- Despite a decrease over time in all three Belgian regions, consumption has remained consistently higher in Wallonia (17.8 daily doses per 1000 inhabitants and per day in 2021) and consistently lower in Brussels (14.8 in 2021), with Flanders somewhere in between (15.6 in 2021). There were, however, substantial differences between provinces.
- The decrease in consumption is spread quite evenly over all subgroups of antibiotics, but particularly significant for quinolones, following the restrictions on their reimbursement introduced in 2018.
Link to the technical sheet and detailed results
Data source: Sciensano
Percentage of the population with at least one antibiotic prescription a year (QA-4)
- In 2021, 32.6% of the Belgian population received at least one antibiotic prescription, with some differences between regions (37% in Wallonia, 30.4% in Flanders and 29.6% in Brussels). Here too, there was a sharp drop in 2020, with a rebound slightly above the 2019 level in 2021.
- The percentage of citizens with at least one antibiotic prescription was highest among the very young (0-4 years old) and the very old (over 75 years old).
Link to the technical sheet and detailed results
Data source: IMA - AIM
Share of second-line antibiotic treatments in the total number of daily doses of antibiotics delivered (QA-5)
- In 2021, 40.5% of antibiotics prescribed were second-line drugs. This share was higher in Wallonia (41,3%) than in Flanders (39.9%) and Brussels (35.9%). There has been a consistent reduction over time in all regions, albeit more slowly in some provinces than in others.
- Likewise, the share of second-line antibiotics has decreased in all age groups and in both genders, though it remains consistently higher in males.
Link to the technical sheet and detailed results
Inappropriate use of medical imaging exams (QA-6)
While medical imaging exams are an essential tool in many situations, many of them (like X-rays and CT scans) use radiation which is not innocuous and can cause cell damage, which in turn increases the risk of cancer. It is therefore very important to make appropriate use of medical imaging to avoid exposing patients to unnecessary risks. Unfortunately, despite national awareness campaigns, the radiation doses Belgian patients are exposed to remain among the highest in Europe.
Moreover, even when they do not use radiation, these techniques also have a considerable cost and should not be used in situations where they have little or no added value, low back pain being a case in point.
Low back pain is an important public health issue because it is very common, causing substantial healthcare consumption and societal costs. In a 2013 Belgian survey, about one respondent in five (among those aged 15 years or more) reported having suffered from some sort of chronic back issue over the past 12 months. In most cases, the diagnosis of (acute or chronic) low back pain does not require imaging unless a cluster of very specific symptoms (“red flags”) is present.
For this indicator, we have examined the number of CT-scan, X-ray and MRI examinations of the spine performed in Belgium in an attempt to assess how frequently patients were prescribed imaging to diagnose a low back issue. This is, however, not a perfectly accurate measure of inappropriate use in this situation, firstly because there might still be a number of cases where the examination was justified, and secondly because available data for MRI and CT-scans do not allow us to distinguish between imaging of the spine in general and imaging of the lumbar (lower) spine.
Results
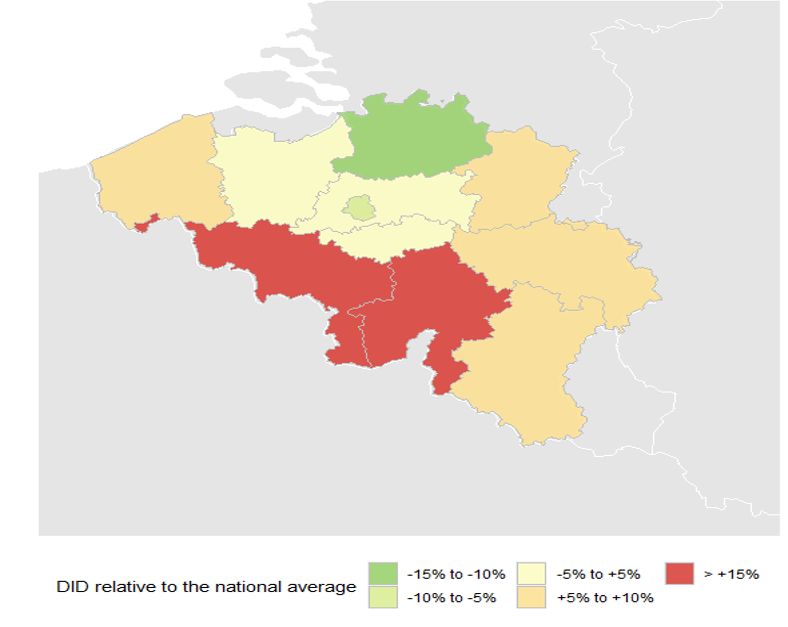
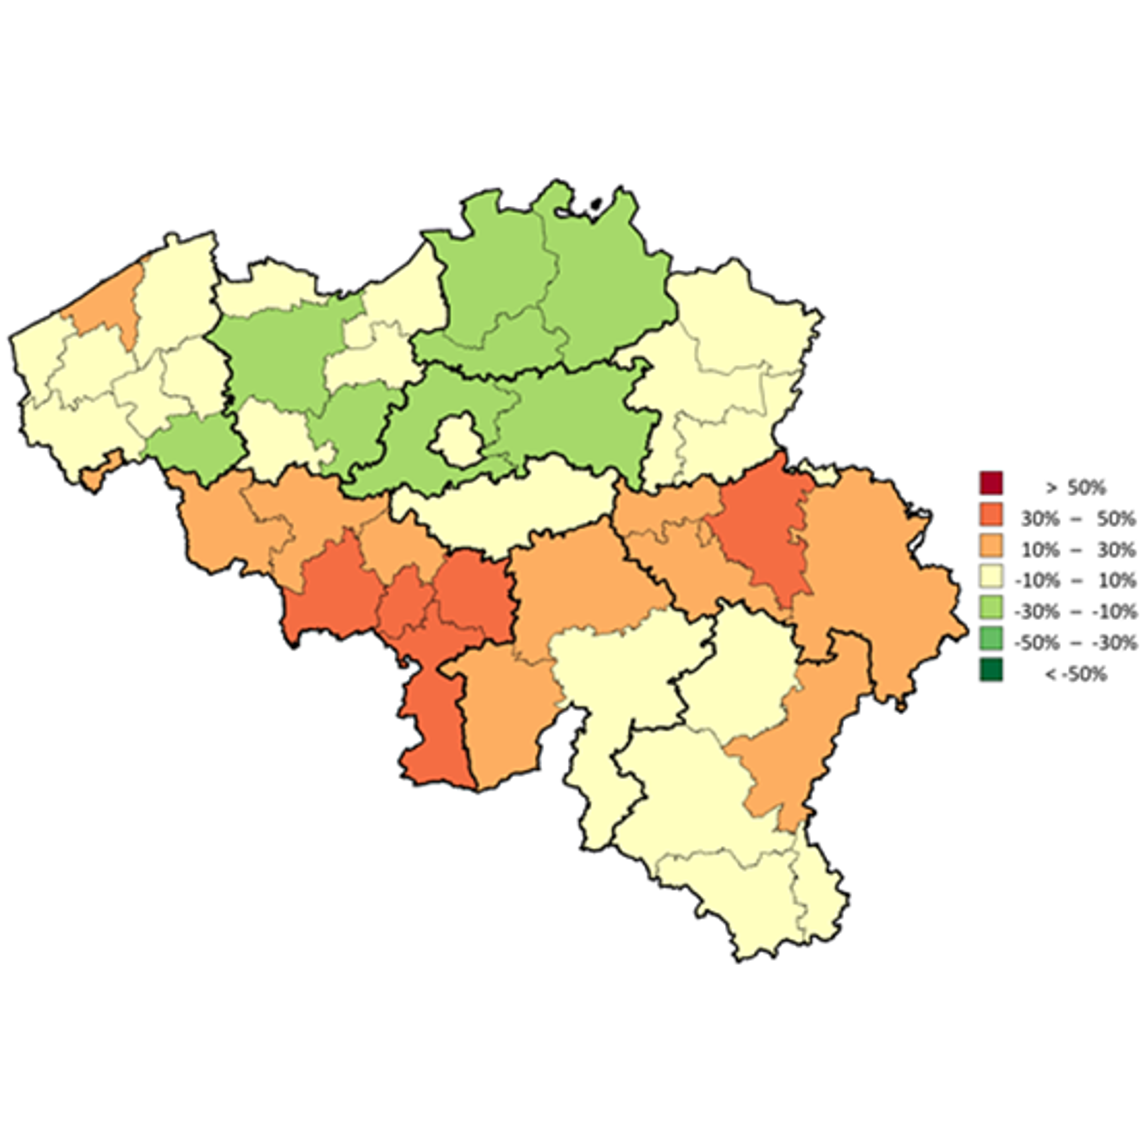
• Over the 2016-2022 period, the number of imaging exams of the spine fell by 2% per year overall (-4.9%/year for X-rays and -1.5%/year for CT-scans, but still +2.0%/year for MRI).
• The number of imaging exams per 100 000 inhabitants is higher in Wallonia (11 370 /100 000 in 2022) than in Brussels (8618/100 000) and Flanders (8378 /100 000). There are also substantial differences between districts.
• The use of the individual exams also varies considerably between regions, particularly for CT-scans.
Link to the technical sheet and detailed results
Data source: INAMI – RIZIV
Data source: INAMI - RIZIV
Number of caesarean sections per 1000 live births (QA-8)
While there is no doubt that caesarean section (C-section) is medically necessary in some circumstances, its benefits in situations where it is used for non-medical reasons continue to be debated. Combined with its higher cost (compared to normal, vaginal delivery), evidence of risks for both mother and child raises questions about its appropriateness in some situations where it is not medically required. In response to these concerns, various countries and international organisations have formulated guidelines to promote natural childbirth, raise awareness of the risks and reduce unnecessary C-sections.
From 1985 up to 2015, the position of the international healthcare community was that the C-sections rate should not exceed 10-15%. In 2015, however, WHO stated that “every effort should be made to provide caesarean sections to women in need, rather than striving to achieve a specific rate”. Caesarean delivery rates are still increasing in most European countries; this is linked, among other reasons, to an increase in maternal age, and to obesity.
Results
- In 2021, the C-section rate for Belgium as a whole was 217 per 1000 live births (+11.3% compared to 2010, where it was 194 per 1000 live births), well above recommended values.
- In 2021, the C-section rate was 224 per 1000 live births in Wallonia, 218 in Flanders and 201 in Brussels, with an increase in all three regions compared to 2010.
- Repeated C-sections are the biggest contributor to the total C-section rate.
- Despite an increase over the years, Belgium rates remained below EU-14 and EU-27 averages from 2010 to 2020.
Link to the technical sheet and detailed results
Data source: OECD health data 2023
Patients with early testicular cancer receiving adjuvant treatment after surgery (QA-9)
Testicular cancer is an uncommon cancer (435 new cases in Belgium in 2021) which typically affects younger men; in 2021, 76.6% of patients belonged to the group between 20 and 39 years old. The treatment usually involves surgery to remove the affected testicle. After the operation, an additional (adjuvant) treatment can be given to destroy any remaining cancer cells and limit the risk of the cancer coming back. However, options like chemotherapy or radiotherapy can also have long-term side effects. Good clinical practice guidelines from 2013 therefore recommend an adequate follow-up rather than adjuvant treatment in patients with a localised (stage I) tumour, especially those who have no specific risk factors.
Results
- A clear decrease in the proportion of stage I patients receiving adjuvant treatment has been observed between the period before and after the publication of the guidelines; this trend is observed in all regions.
- The percentage of stage I patients receiving adjuvant treatment is highest in Flanders, both before (79.0%) and after (45.5%) the publication of new guidelines. Before publication of the guidelines, rates in Wallonia and Brussels were fairly similar (65.1% and 65.7%, respectively). After the guidelines were published, rates dropped in both regions, but more so in Brussels (25.7%) than in Wallonia (35.9%).
Link to the technical sheet and detailed results
Data source: BCR & IMA - AIM