
Key figures
On this table, when a statistical test has been performed, the data showing a significant difference is displayed on a yellow background, otherwise on a grey background.
The geographical dispersion marker Δ shows the result of comparing the coefficient of variation (CV) of the indicator with the median (MED) of the CVs of all analyses for this indicator: δ if CV > MED + 10%, δδ if CV > MED + 20%, δδδ if CV > MED + 30% (Exception: For median age, δ means CV > MED + 30%).
Data
NIHDI nomenclature codes selected for analysis
| CODES | LABEL | CREATION | DELETION |
| 158874-158885 | Ensemble des cathéters et accessoires utilisés lors de la prestation 589492-589503 de la nomenclature | 01-07-2014 | |
| 158896-158900 | Ensemble des cathéters et accessoires utilisés lors de la prestation 589514-589525 de la nomenclature | 01-07-2014 | |
| 158911-158922 | Ensemble des cathéters et accessoires utilisés lors de la prestation 589536-589540 de la nomenclature | 01-07-2014 | |
| 158933-158944 | Ensemble des cathéters et accessoires utilisés lors de la prestation 589551-589562 de la nomenclature | 01-07-2014 | |
| 158955-158966 | Cathéter supplémentaire utilisé pour un système de navigation en 3D remplaçant partiellement la fluoroscopie, lors des prestations 589536-589540 et 589551-589562 de la nomenclature | 01-07-2014 | |
| 476276-476280 | Examen électrophysiologique approfondi sans ablation en vue de l'éveil et de l'arrêt de tachycardies au moyen de trois cathéters ou plus, y compris la prise d'échantillons de sang, les contrôles radioscopiques et électrocardiographiques, l'administration de produits pharmaceutiques et opacifiants, avec protocole et tracés | 01-01-1992 | |
| 476291-476302 | Examen électrophysiologique restreint sans ablation en vue de l'étude de la fonction du noeud sino-auriculaire et de la conduction atrioventriculaire au moyen d'un ou de plusieurs cathéters, y compris les enregistrements électrocardiographiques | 01-01-1992 | |
| 476313-476324 | Diagnostic et/ou traitement de tachycardies par stimulations électriques au moyen d'un ou plusieurs cathéters endocavitaires, y compris les enregistrements électrocardiographiques | 01-01-1992 | |
| 589492-589503 | Examen électrophysiologique et ablation percutanée pour le traitement d'une tachycardie auriculo-ventriculaire par réentrée nodale, d'une tachycardie auriculo-ventriculaire par réentrée par faisceau accessoire de Kent ou d'une tachycardie auriculaire ectopique droite, par ablation spécifique du circuit ou du foyer d'arythmie | 01-11-2007 | |
| 589514-589525 | Examen électrophysiologique et ablation percutanée pour le traitement d'un flutter auriculaire droit par ablation spécifique du circuit d'arythmie | 01-11-2007 | |
| 589536-589540 | Examen électrophysiologique et ablation percutanée pour le traitement d'arythmies ventriculaires par ablation spécifique du circuit ou du foyer d'arythmie | 01-11-2007 | |
| 589551-589562 | Examen électrophysiologique et ablation percutanée pour le traitement d'un flutter auriculaire gauche (par ablation spécifique du circuit ou du foyer d'arythmie) ou d'une fibrillation auriculaire (par isolation ou ablation circonférentielle des veines pulmonaires) | 01-11-2007 | |
| 589573-589584 | Examen électrophysiologique et ablation percutanée du faisceau de His | 01-11-2007 | |
| 697572-697583 | Ensemble des cathéters et accessoires utilisés lors de la prestation 589492-589503 | 01-11-2007 | 30-06-2014 |
| 697594-697605 | Ensemble des cathéters et accessoires utilisés lors de la prestation 589514-589525 | 01-11-2007 | 30-06-2014 |
| 697616-697620 | Ensemble des cathéters et accessoires utilisés lors de la prestation 589536-589540 | 01-11-2007 | 30-06-2014 |
| 697631-697642 | Ensemble des cathéters et accessoires utilisés lors de la prestation 589551-589562 | 01-11-2007 | 30-06-2014 |
| 697653-697664 | Cathéter supplémentaire utilisé pour un système de navigation en 3D remplaçant partiellement la fluoroscopie, lors des prestations 589536-589540 et 589551-589562 | 01-11-2007 | 30-06-2014 |
The codes mentioned above can be used in rates and expenses, or only in expenses. We invite you to consult the full report for more information.
Below is a graph showing the evolution of the breakdown by volume of nomenclature codes used for the rates:

Population selection
No selection
Analysis period
2025
Graphics
 Nomenclature codes
 Age, gender and CV
 Rates by sex
 Reimbursement rate
 Trends by region
 Trends break
 Dot Plot
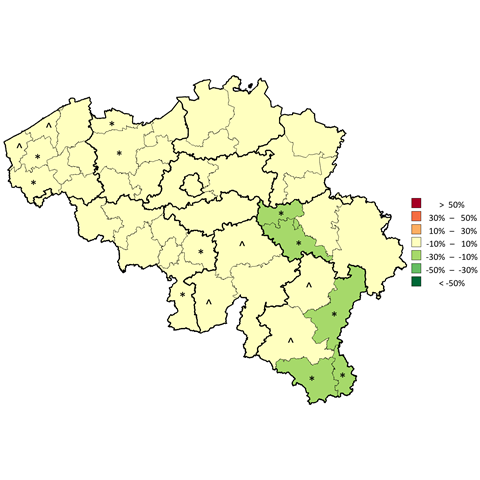
 Distribution map
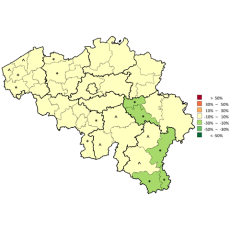 Expenses Distribution map
 Funnel plot
 Patient care settings
 Occurrences per year
 Occurrences per day





Comments
WE ARE INTERESTED IN YOUR OPINION
Do you have any experience in this area ? We listen to you !