Key figures
On this table, when a statistical test has been performed, the data showing a significant difference is displayed on a yellow background, otherwise on a grey background.
The geographical dispersion marker Δ shows the result of comparing the coefficient of variation (CV) of the indicator with the median (MED) of the CVs of all analyses for this indicator: δ if CV > MED + 10%, δδ if CV > MED + 20%, δδδ if CV > MED + 30% (Exception: For median age, δ means CV > MED + 30%).
Data
NIHDI nomenclature codes selected for analysis
| CODES | LABEL | CREATION | DELETION |
| 350055-350066 | Recherche d'une hypersensibilité allergique immédiate au moyen de prick tests avec des solutions allergiques et de contrôle commerciales aux pneumallergènes (minimum 10 tests) et/ou trophallergènes (minimum 8 tests) et/ou hyménoptères, avec rapport de synthèse | 01-04-1985 | |
| 470750-470761 | Recherche d'une hypersensibilité allergique immédiate au moyen de scratch tests ou prick tests (alimentaires prick-to-prick) avec des aliments frais (« native ») (minimum 5 tests) et/ou un composant de médicaments (minimum 5 tests) et des solutions de contrôle, avec rapport de synthèse | 01-05-2009 | |
| 470772-470783 | Recherche d'une hypersensibilité allergique différée à un médicament ou à certains aliments au moyen de patch tests (minimum 5 tests), avec lecture à des moments ultérieurs, avec rapport de synthèse | 01-05-2009 | |
| 470794-470805 | Recherche en milieu hospitalier d'une hypersensibilité à un médicament (ou ses composants) après des scratch tests ou prick tests négatifs pour ce médicament (ou ses composants) par intradermoréactions à doses croissantes d'allergène, avec rapport de synthèse | 01-05-2009 | |
| 470816-470820 | Recherche en milieu hospitalier d'une hypersensibilité au venin d'hyménoptères après des prick tests négatifs par intradermoréactions avec des séries de dilution de un ou plusieurs venins avec lecture immédiate, avec rapport de synthèse | 01-05-2009 | |
| 532534-532545 | Recherche d'allergène pour dermatite allergique, par tests épicutanés, d'une série standard de minimum 22 tests ou, par photopatchtests, avec minimum 10 tests, avec protocole | 01-07-1986 | |
| 532556-532560 | Recherche d'allergène pour dermatite allergique, par tests épicutanés ou par photopatchtests, pour une série de tests complémentaires, avec protocole, (minimum 10 antigènes) | 01-07-1986 | |
| 532571-532582 | Recherche d'allergène pour dermatite allergique, par tests épicutanés ou par photopatchtests, avec composants isolés d'un produit allergénique avec protocole, (minimum 10 composants) | 01-07-1986 | |
| 532615-532626 | Recherche de l'hypersensibilité à la lumière par des tests de lumière | 01-07-1999 |
The codes mentioned above can be used in rates and expenses, or only in expenses. We invite you to consult the full report for more information.
Below is a graph showing the evolution of the breakdown by volume of nomenclature codes used for the rates:
")
Population selection
No selection
Analysis period
2024
Graphics
 Nomenclature codes
 Age, gender and CV
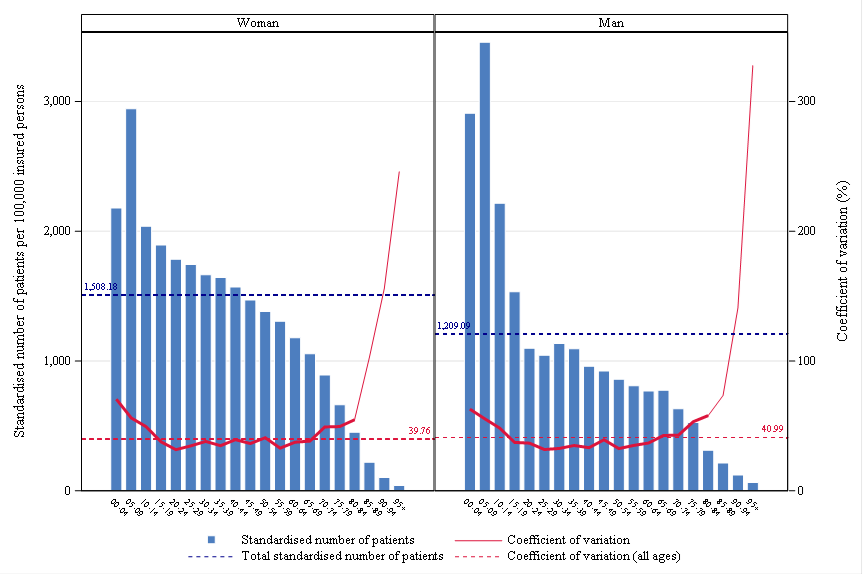
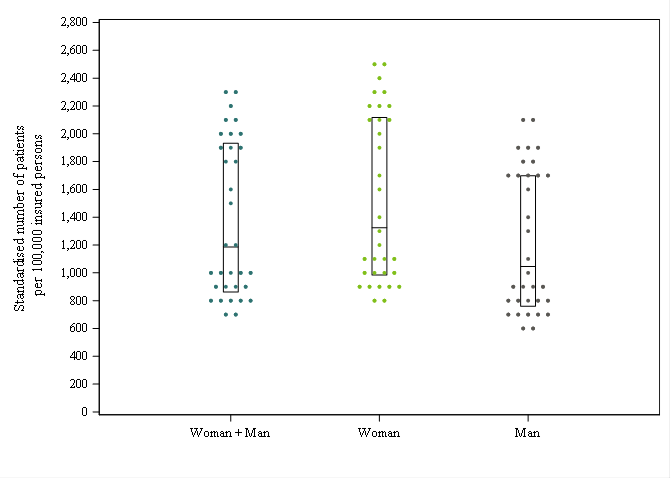
 Rates by sex
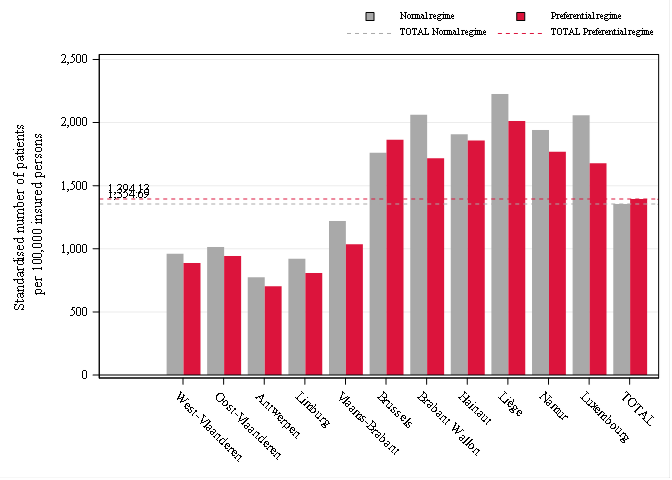
 Reimbursement rate
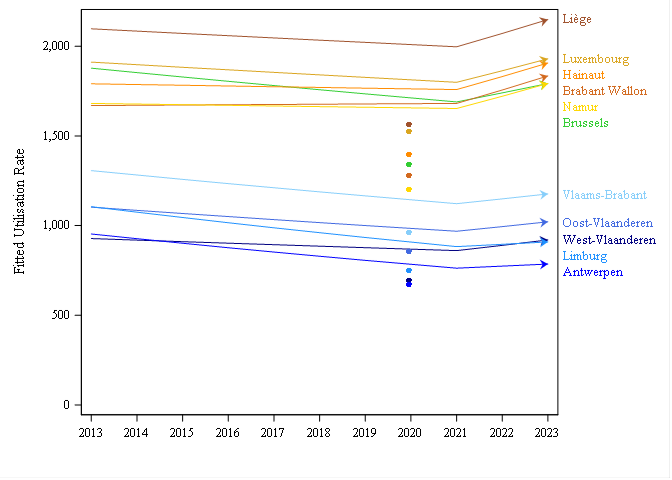
 Trends by region
 Trends break
 Dot Plot
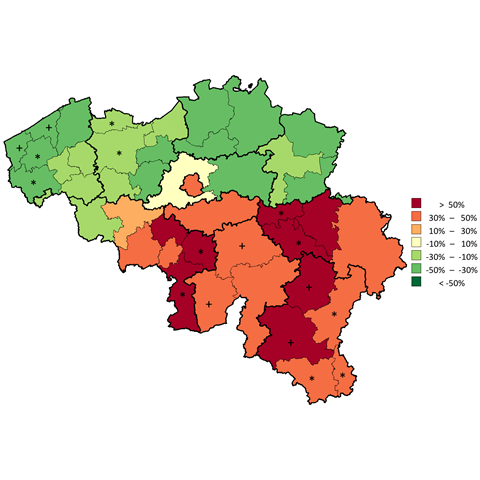
 Distribution map
 Expenses Distribution map
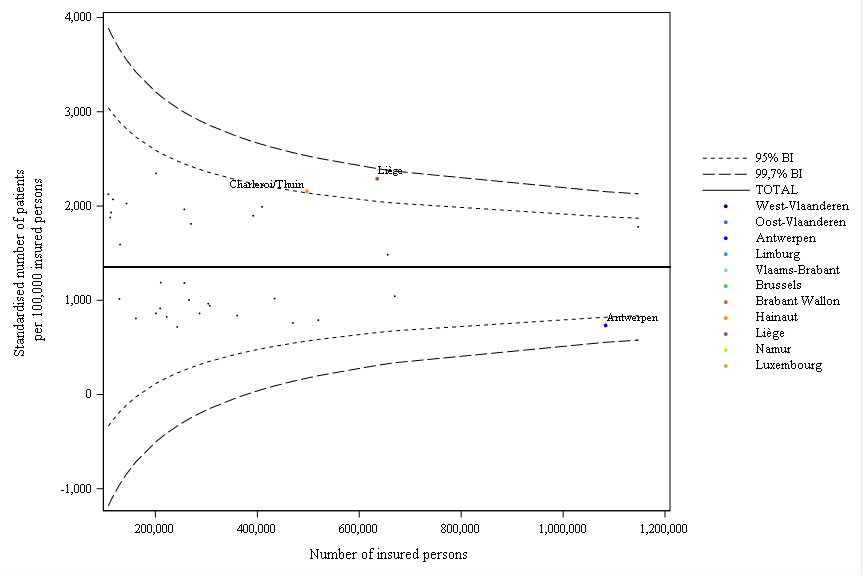
 Funnel plot
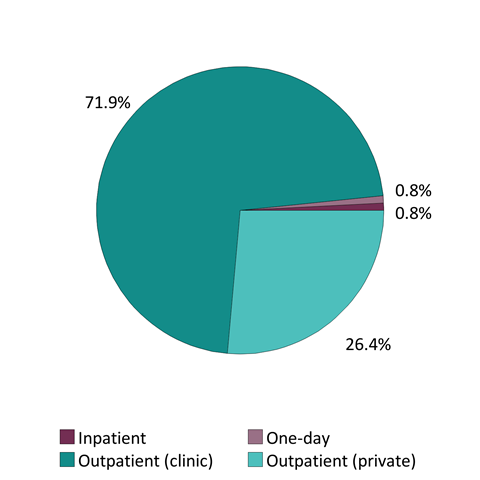
 Patient care settings
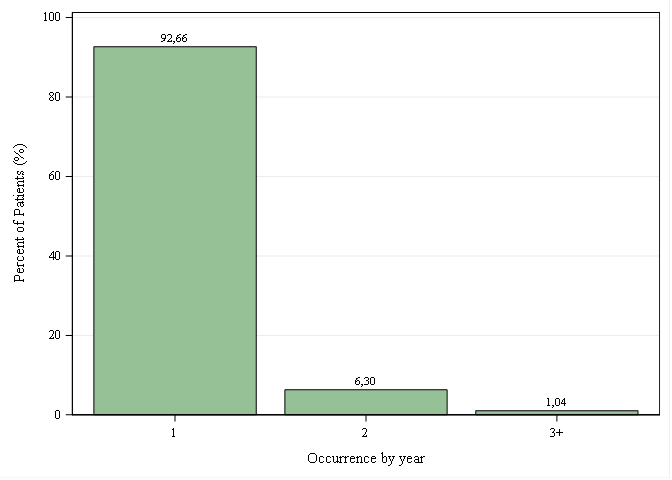
 Occurrences per year
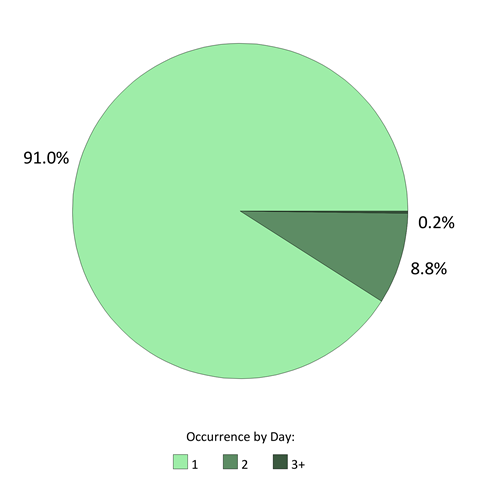
 Occurrences per day


Comments
WE ARE INTERESTED IN YOUR OPINION
Do you have any experience in this area ? We listen to you !