Key figures
On this table, when a statistical test has been performed, the data showing a significant difference is displayed on a yellow background, otherwise on a grey background.
The geographical dispersion marker Δ shows the result of comparing the coefficient of variation (CV) of the indicator with the median (MED) of the CVs of all analyses for this indicator: δ if CV > MED + 10%, δδ if CV > MED + 20%, δδδ if CV > MED + 30% (Exception: For median age, δ means CV > MED + 30%).
Data
NIHDI nomenclature codes selected for analysis
| CODES | LABEL | CREATION | DELETION |
| 476210-476221 | Monitoring de Holter : Enregistrement électrocardiographique continu pendant 24 heures au moins, au moyen d'un appareil portable à bande magnétique ou à mémoire interne, y compris la consultation lors de la pose et de l'enlèvement de l'appareil, avec protocole et possibilité de reproduire les tracés complets | 01-04-1985 | |
| 476232-476243 | Répétition dans le délai d'un an de la prestation n° 476210 - 476221 | 01-04-1985 | |
| 476254-476265 | Monitoring de Holter : analyse électrocardiographique continue pendant 24 heures au moins, au moyen d'un appareil portable, y compris la consultation lors de la pose et de l'enlèvement de l'appareil,avec protocole et possibilité de reproduire une partie des tracés | 01-08-1988 |
The codes mentioned above can be used in rates and expenses, or only in expenses. We invite you to consult the full report for more information.
Below is a graph showing the evolution of the breakdown by volume of nomenclature codes used for the rates:
")
Population selection
No selection
Analysis period
2024
Graphics
 Nomenclature codes
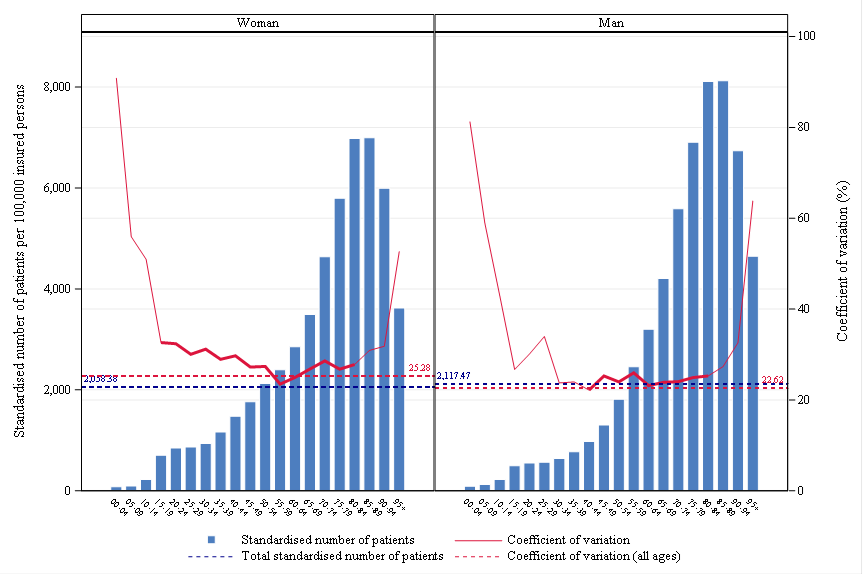
 Age, gender and CV
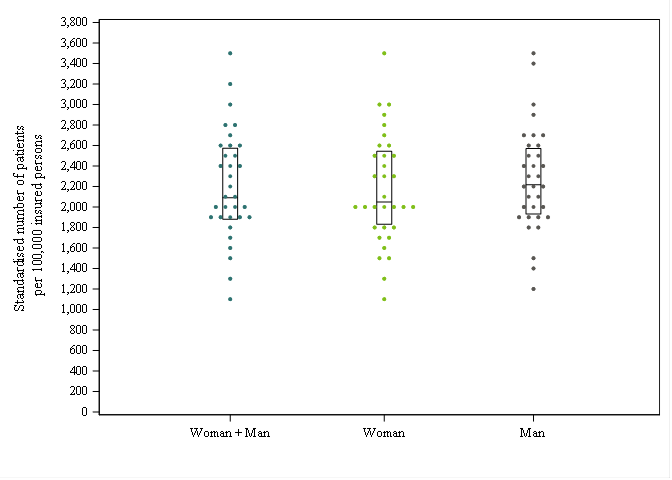
 Rates by sex
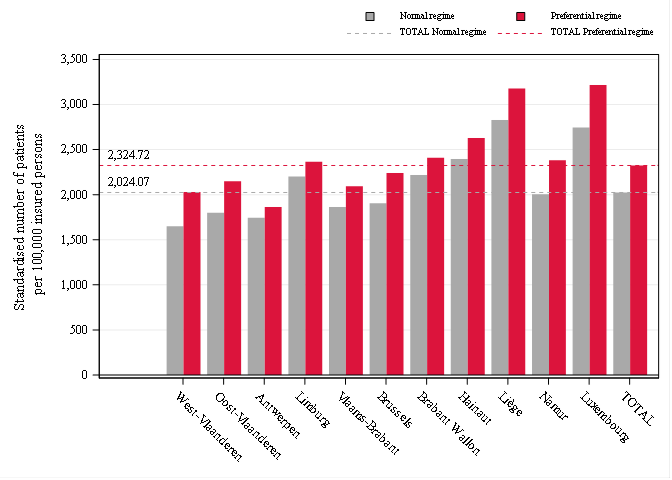
 Reimbursement rate
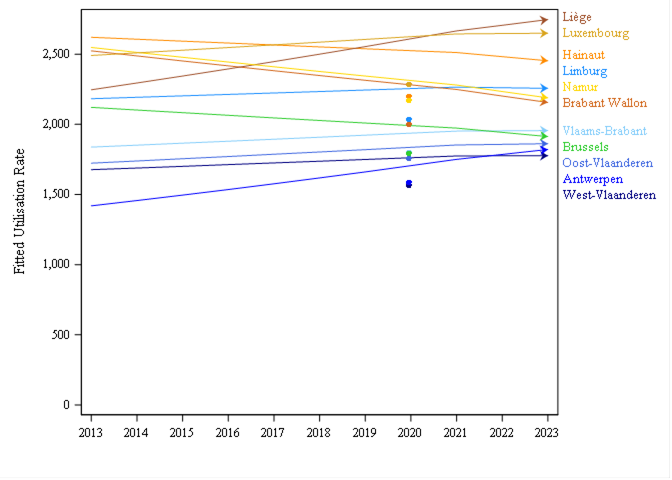
 Trends by region
 Trends break
 Dot Plot
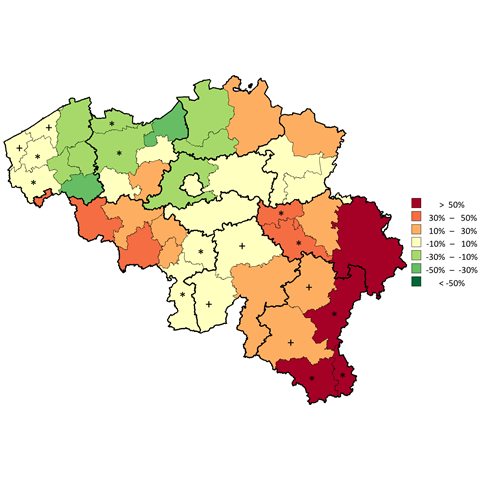
 Distribution map
 Expenses Distribution map
 Funnel plot
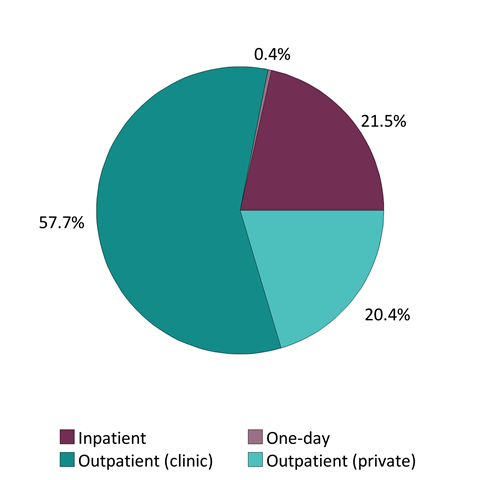
 Patient care settings
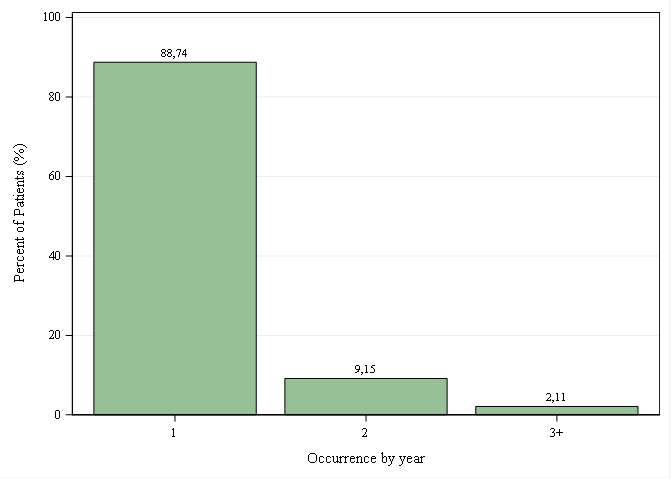
 Occurrences per year
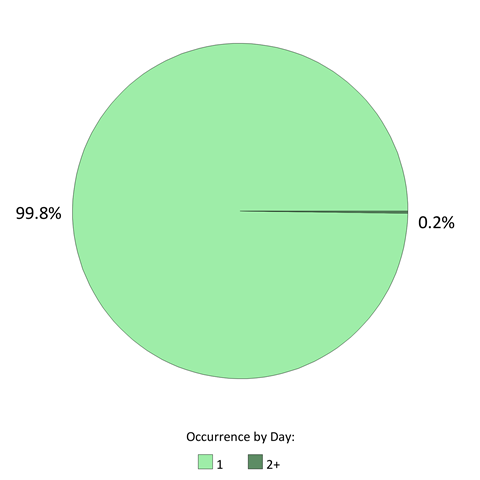
 Occurrences per day


Comments
WE ARE INTERESTED IN YOUR OPINION
Do you have any experience in this area ? We listen to you !