Key figures
On this table, when a statistical test has been performed, the data showing a significant difference is displayed on a yellow background, otherwise on a grey background.
The geographical dispersion marker Δ shows the result of comparing the coefficient of variation (CV) of the indicator with the median (MED) of the CVs of all analyses for this indicator: δ if CV > MED + 10%, δδ if CV > MED + 20%, δδδ if CV > MED + 30% (Exception: For median age, δ means CV > MED + 30%).
Data
NIHDI nomenclature codes selected for analysis
| CODES | LABEL | CREATION | DELETION |
| 256594-256605 | ** Prélèvement biopsique du larynx | 01/04/1985 | |
| 257375-257386 | Prélèvement biopsique du larynx pratiqué chez un enfant de moins de cinq ans | 01/04/1985 | |
| 258075-258086 | Microlaryngoscopie en suspension (Kleinsasser) avec ou sans prélèvement biopsique | 01/04/1985 | |
| 258974-258985 | Examen anatomo-physiologique du laryngo-pharynx concernant la déglutition au moyen d’un scope flexible avec enregistrement vidéo, y compris le rapport de la provocation de la déglutition où au moins 2 substances et/ou consistances sont utilisées | 01/07/2021 | |
| 351035-351046 | ** Trachéo- et/ou laryngoscopie, avec ou sans prélèvement biopsique | 01/04/1985 |
The codes mentioned above can be used in rates and expenses, or only in expenses. We invite you to consult the full report for more information.
Below is a graph showing the evolution of the breakdown by volume of nomenclature codes used for the rates:
")
Population selection
No selection
Analysis period
2024
Graphics
 Nomenclature codes
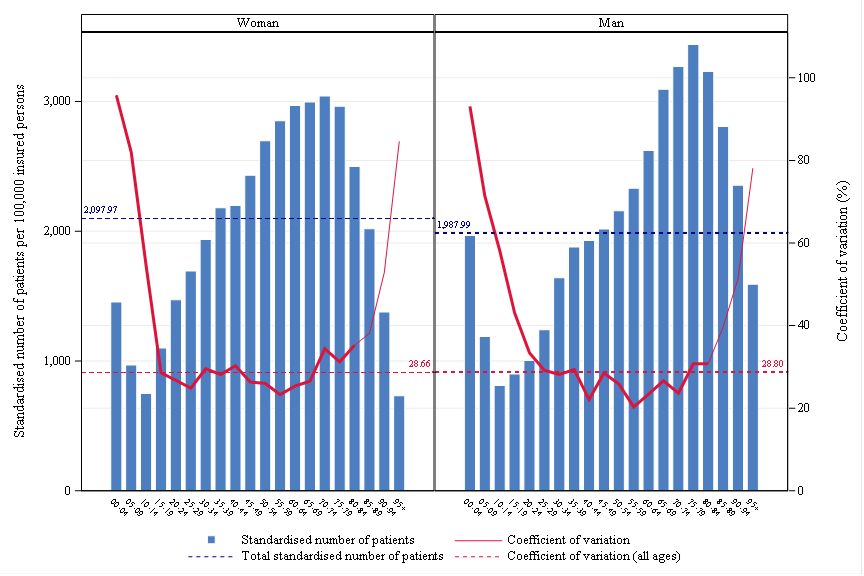
 Age, gender and CV
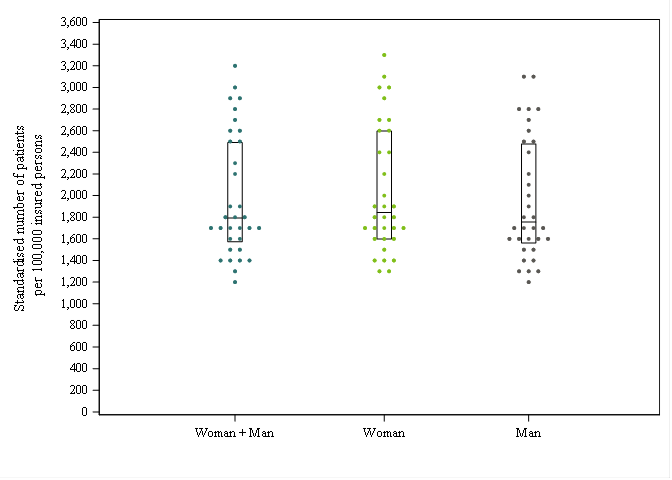
 Rates by sex
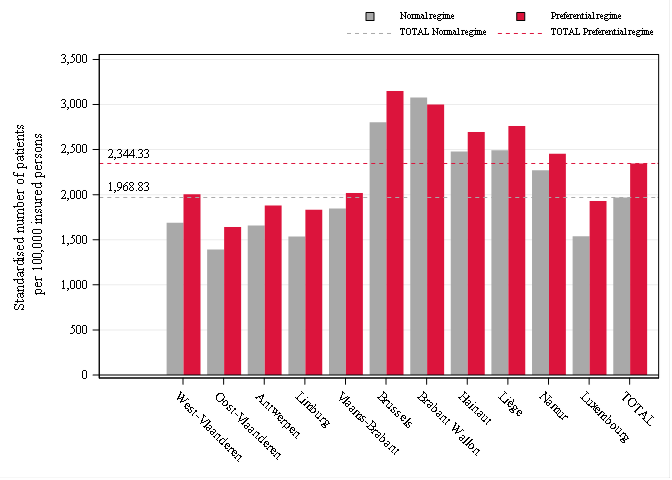
 Reimbursement rate
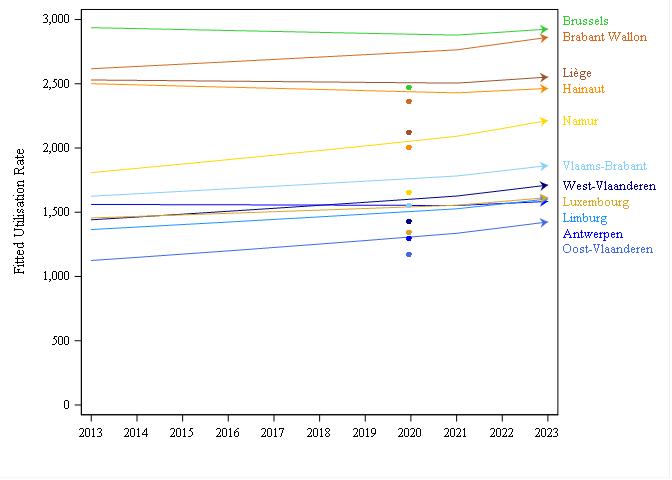
 Trends by region
 Trends break
 Dot Plot
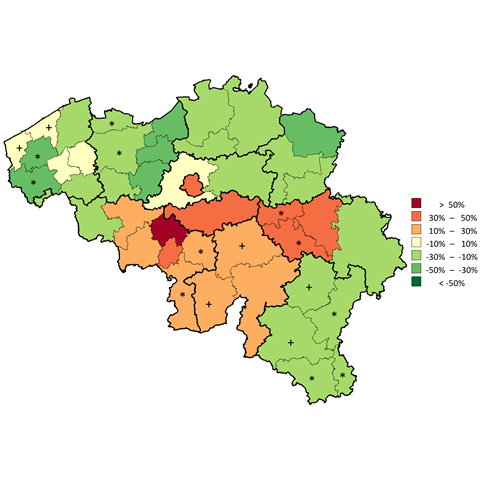
 Distribution map
 Expenses Distribution map
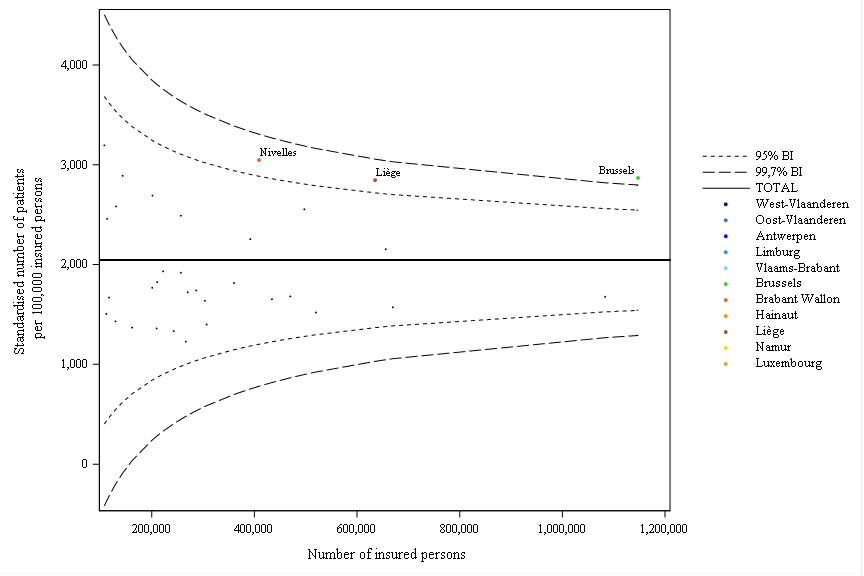
 Funnel plot
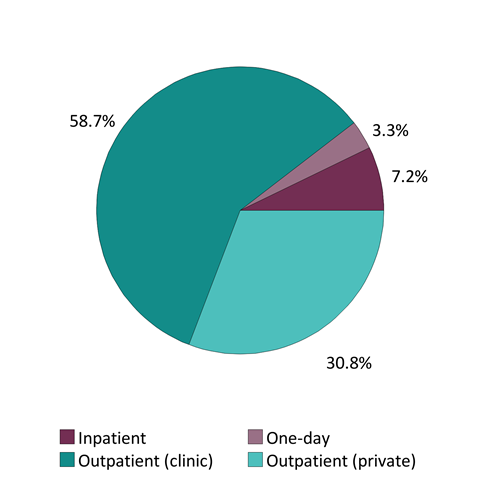
 Patient care settings
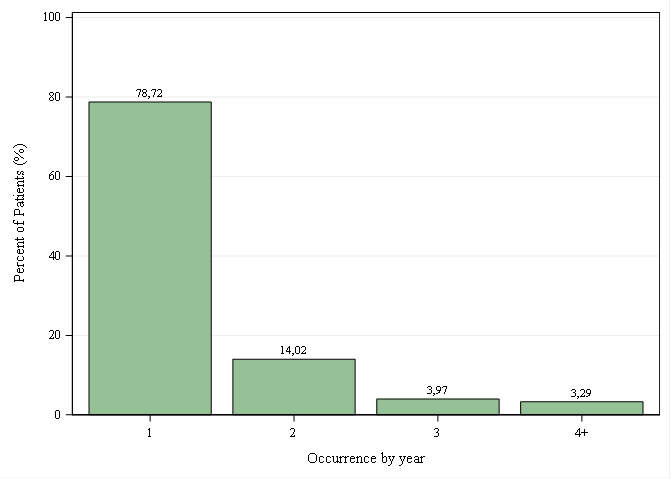
 Occurrences per year
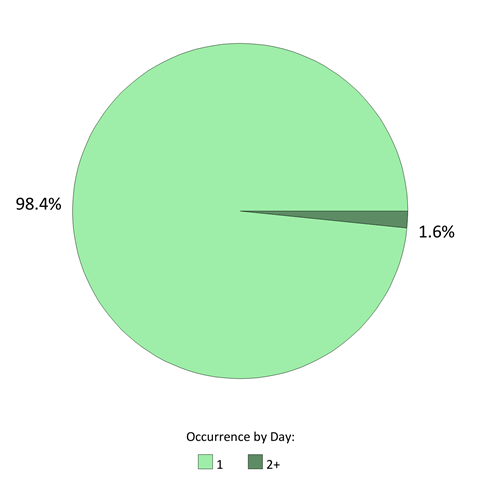
 Occurrences per day


Comments
WE ARE INTERESTED IN YOUR OPINION
Do you have any experience in this area ? We listen to you !