Key figures
On this table, when a statistical test has been performed, the data showing a significant difference is displayed on a yellow background, otherwise on a grey background.
Data
NIHDI nomenclature codes selected for analysis
| CODES | LABEL | CREATION | DELETION |
| 254973 254984 |
Supplément pour audiométrie vocale lorsque celle-ci est exécutée en même temps qu'une audiométrie tonale | 01-05-2007 | |
| 255010 255021 |
Audiométrie tonale ou vocale réalisée en chambre insonore | 01-07-1986 | |
| 255032 255043 |
Audiométrie tonale ou vocale avec un ou plusieurs tests complémentaires : - test supraliminaire - étude des acouphènes en intensité et en fréquence - test d'orientation ou de latéralisation | 01-07-1986 | |
| 255054 255065 |
Audiométrie tonale ou vocale avec un ou plusieurs tests complémentaires : - test supraliminaire - étude des acouphènes en intensité et en fréquence - test d'orientation ou de latéralisation et réalisée en chambre insonore | 01-07-1986 | |
| 255076 255080 |
Audiométrie comportementale avec rapport, interrogeant au moins trois zones de fréquence chez l'enfant de moins de six ans | 01-07-1986 | |
| 257736 257740 |
Impédance-métrie du tympan, de l'oreille moyenne et de la chaîne ossiculaire, avec protocole et tympanogramme, y compris le réflexe stapédien éventuel | 01-04-1985 | |
| 257795 257806 |
Potentiels cérébraux évoqués par stimulation auditive et/ou examen électrocochléographique, avec protocole et extraits des tracés | 01-04-1985 | |
| 258296 258300 |
Examen du fonctionnement cochléaire par enregistrement des otoémissions spontanées et/ou provoquées | 01-11-1992 | |
| 258613 258624 |
Potentiels cérébraux évoqués par stimulation auditive et/ou examen électrocochléographique, avec protocole et extraits des tracés, réalisés chez le nouveau-né | 01-07-1986 | |
| 478074 478085 |
Enregistrement des potentiels évoqués auditifs | 01-11-2012 |
The codes mentioned above can be used in rates and expenses, or only in expenses. We invite you to consult the full report for more information.
Below is a graph showing the evolution of the breakdown by volume of nomenclature codes used for the rates:
")
Population selection
No selection
Analysis period
2023
Graphics
 Nomenclature codes
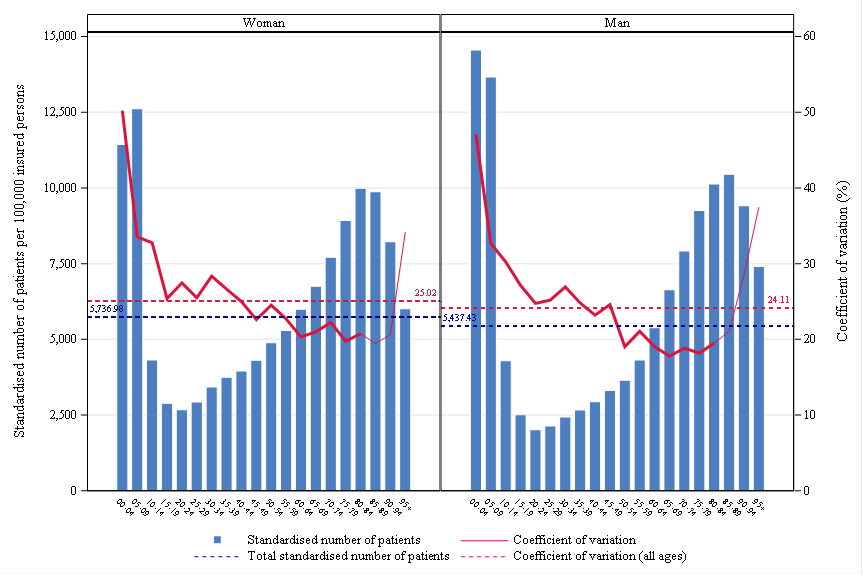
 Age, gender and CV
 Rates by sex
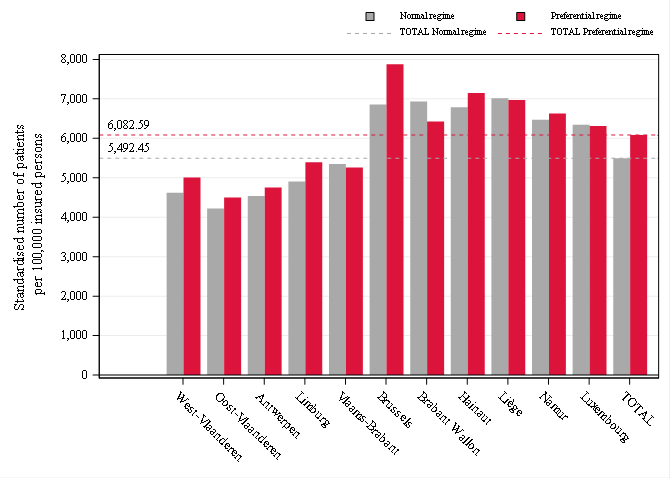
 Reimbursement rate
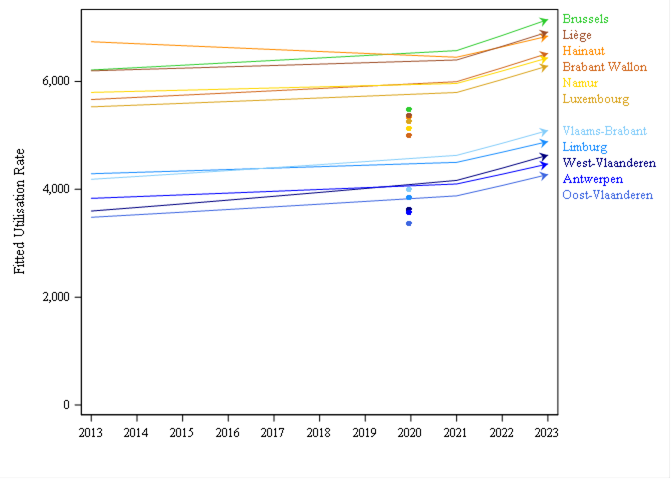
 Trends by region
 Trends break
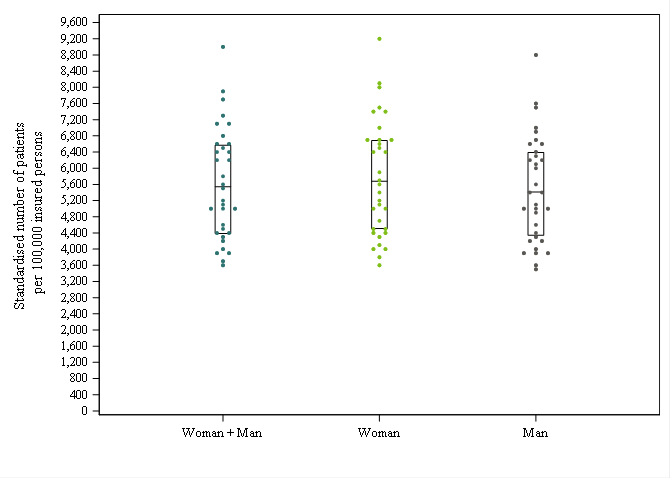
 Dot Plot
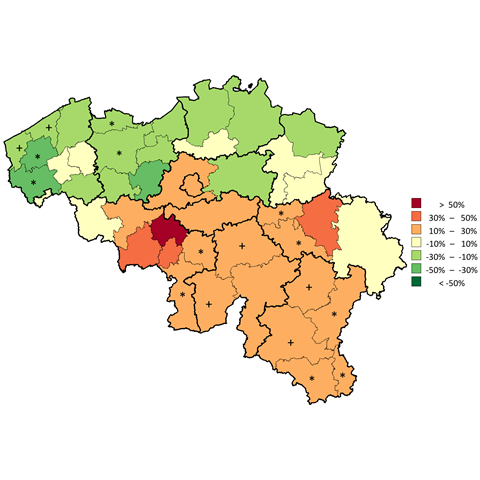
 Distribution map
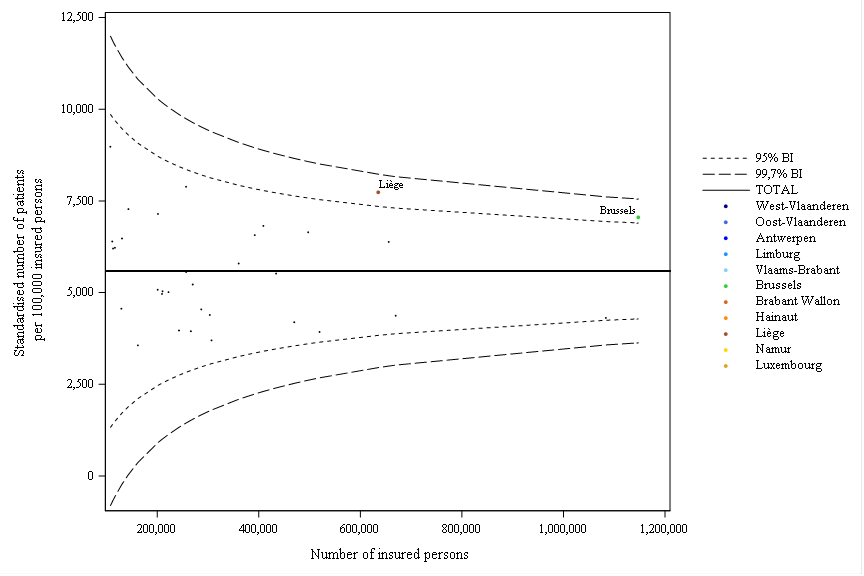
 Funnel plot
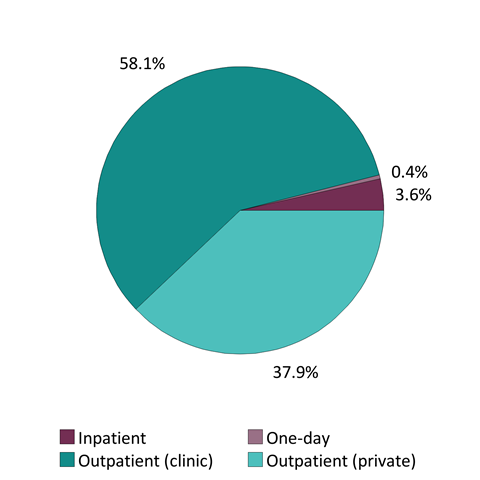
 Patient care settings
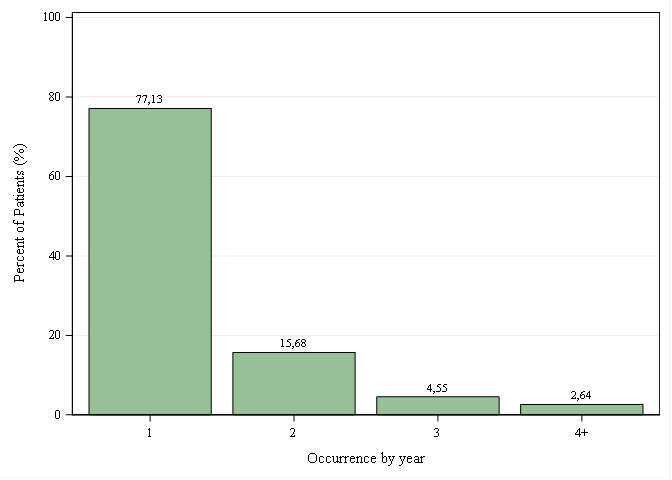
 Occurrences per year
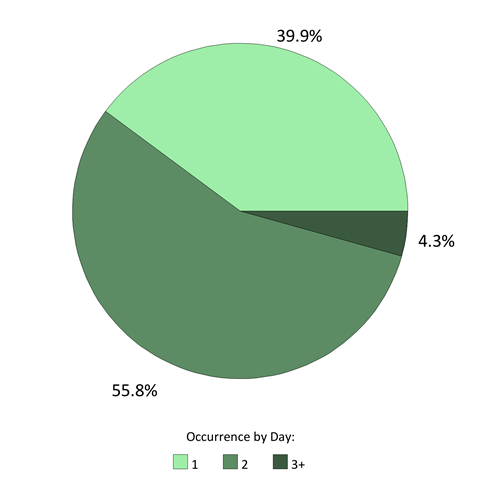
 Occurrences per day


Comments
WE ARE INTERESTED IN YOUR OPINION
Do you have any experience in this area ? We listen to you !