Key figures
On this table, when a statistical test has been performed, the data showing a significant difference is displayed on a yellow background, otherwise on a grey background.
Data
ATC codes selected for analysis
| CODES (ATC-5) | LABELS |
| C01BA | ANTIARRHYTHMICS, CLASS IA |
| C01BB | ANTIARRHYTHMICS, CLASS IB |
| C01BC | ANTIARRHYTHMICS, CLASS IC |
| C01BD | ANTIARRHYTHMICS, CLASS III |
The codes mentioned above can be used in rates and expenses, or only in expenses. We invite you to consult the full report for more information.
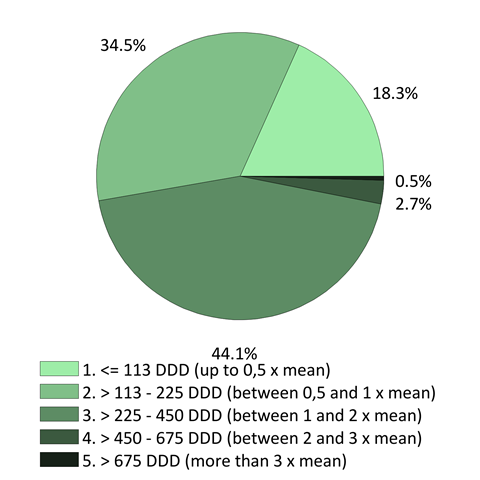
Click below to see the graph illustrating the evolution of the breakdown by volume of ATC codes used for the rates.
 (2023)")
Population selection
No selection
Analysis period
2023
Graphics
 ATC codes
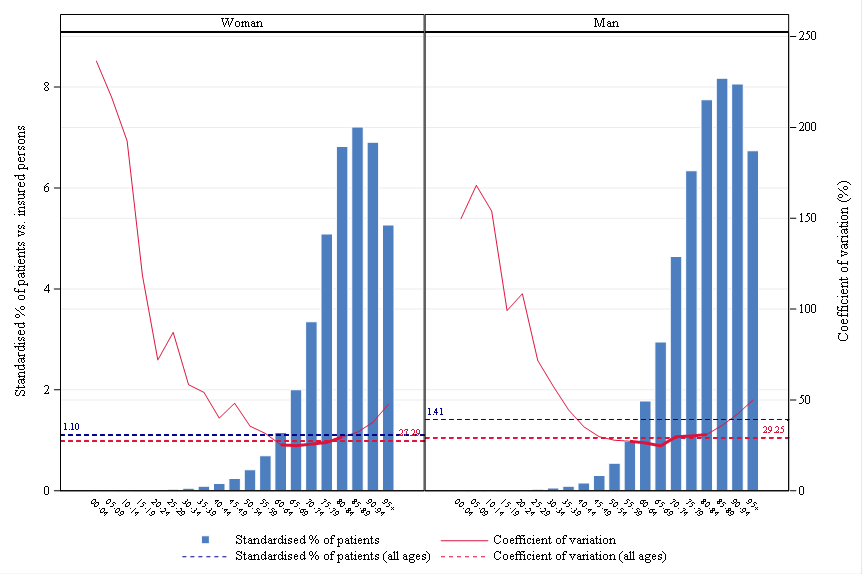
 Age, sex and CV
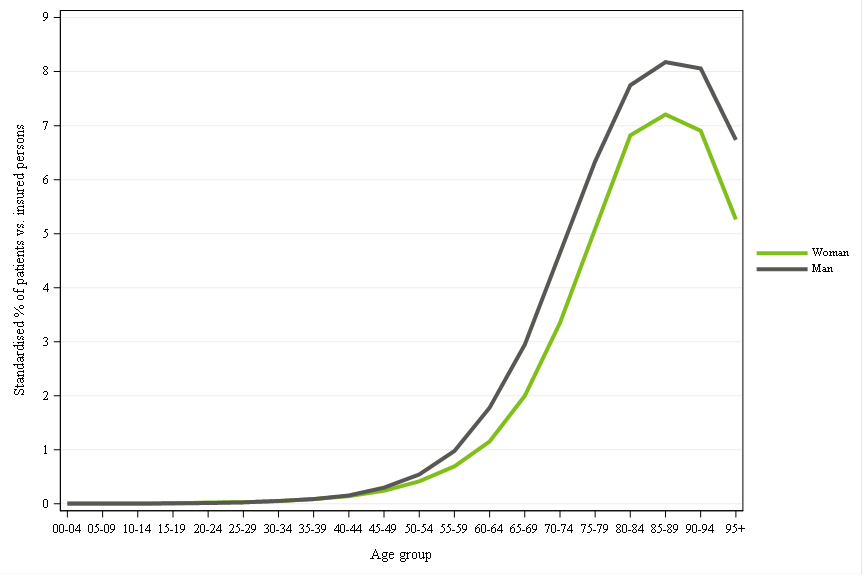
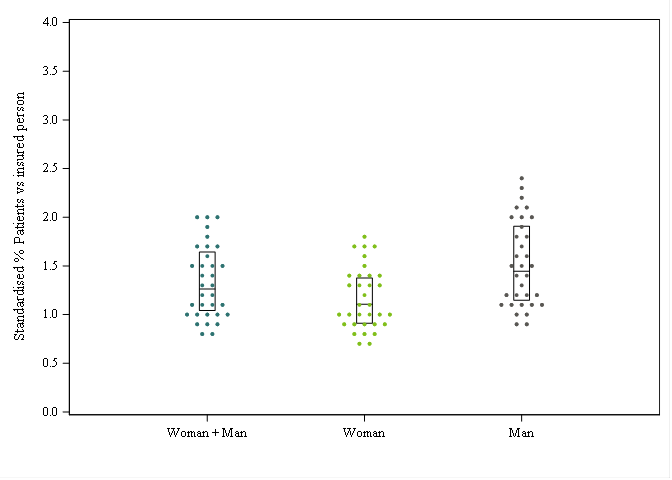
 Rates by sex
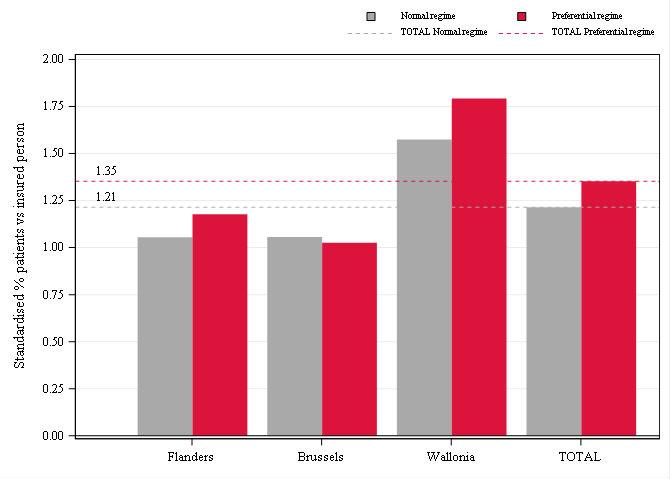
 Reimbursement rate
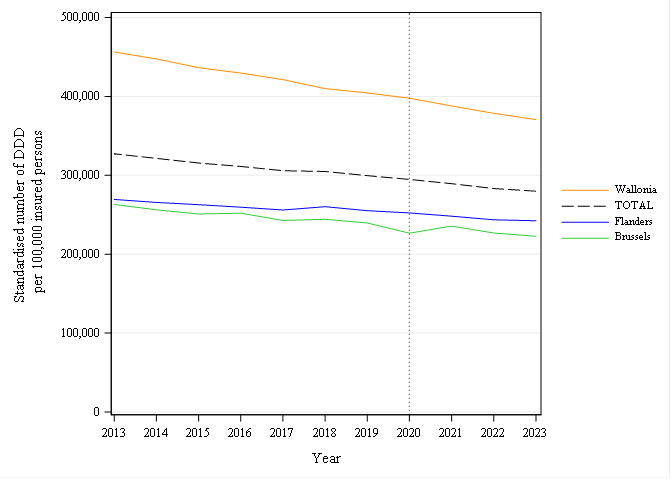
 Trends by region
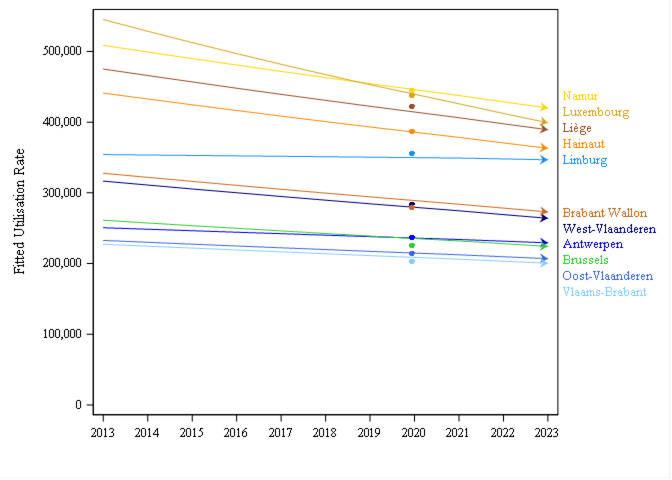
 Trends break
 Dot Plot
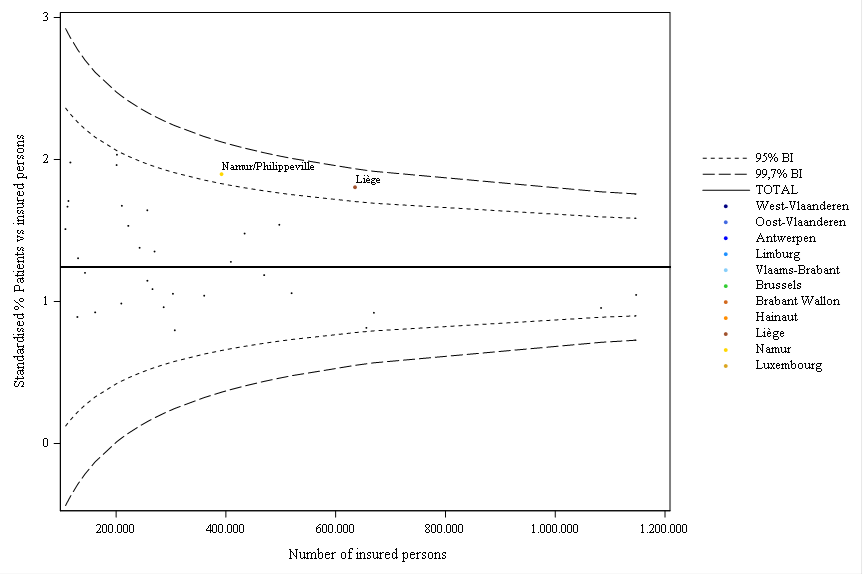
 Funnel plot
 by province") DDD per patient by province
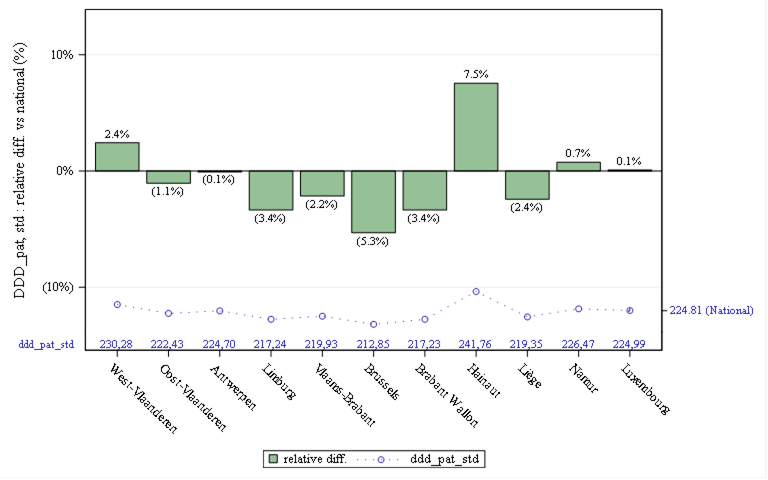
DDD per patient by province Quantity per patient
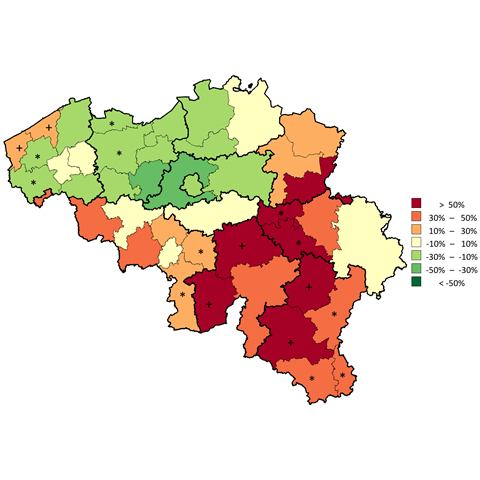
 Distribution map
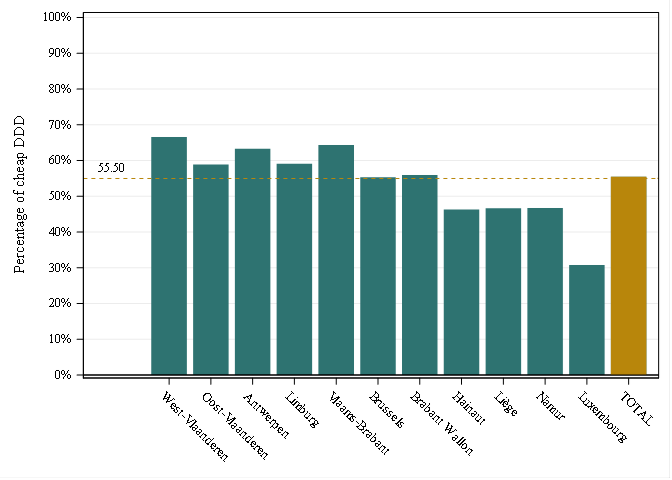
 Low-cost DDD


 by province")


Comments
WE ARE INTERESTED IN YOUR OPINION
Do you have any experience in this area ? We listen to you !