Key figures
On this table, when a statistical test has been performed, the data showing a significant difference is displayed on a yellow background, otherwise on a grey background.
The geographical dispersion marker Δ shows the result of comparing the coefficient of variation (CV) of the indicator with the median (MED) of the CVs of all analyses for this indicator: δ if CV > MED + 10%, δδ if CV > MED + 20%, δδδ if CV > MED + 30% (Exception: For median age, δ means CV > MED + 30%).
Data
NIHDI nomenclature codes selected for analysis
| CODES | LABEL | CREATION | DELETION |
| 444113-444124 | Honoraires forfaitaires pour une série d'irradiations externes simples de 1 à 10 fractions chez un patient qui répond aux critères ou pathologie repris en catégorie 1 | 01-06-2001 | |
| 444135-444146 | Honoraires forfaitaires pour une série d'irradiations externes simples de 11 à 35 fractions chez un patient qui répond aux critères ou pathologie repris en catégorie 2 | 01-06-2001 | |
| 444150-444161 | Honoraires forfaitaires pour une série d'irradiations externes complexes chez un patient qui répond aux critères ou pathologie repris en catégorie 3 | 01-06-2001 | |
| 444172-444183 | Honoraires forfaitaires pour une série d'irradiations externes complexes chez un patient qui répond aux critères ou pathologie repris en catégorie 4 | 01-06-2001 | |
| 444194-444205 | Honoraires forfaitaires pour une série d'irradiations externes exclusives par électrons chez un patient qui répond aux critères ou pathologie repris en catégorie 9 | 01-06-2001 | |
| 444216-444220 | Honoraires forfaitaires pour curiethérapie exclusive chez un patient qui répond aux critères ou pathologie repris en catégorie 7 | 01-06-2001 | |
| 444231-444242 | Honoraires forfaitaires pour curiethérapie exclusive chez un patient qui répond aux critères ou pathologie repris en catégorie 9 | 01-06-2001 | |
| 444253-444264 | Honoraires forfaitaires pour curiethérapie exclusive chez un patient qui répond aux critères ou pathologie repris en catégorie 8 | 01-06-2001 | |
| 444275-444286 | Honoraires forfaitaires pour curiethérapie exclusive chez un patient qui répond aux critères ou pathologie repris en catégorie 10 (prévention de resténose ) | 01-06-2001 | 31-07-2017 |
| 444290-444301 | Honoraires forfaitaires pour curiethérapie combinée à une série d'irradiations externes chez un patient qui répond aux critères ou pathologie repris en catégorie 5 | 01-06-2001 | |
| 444312-444323 | Honoraires forfaitaires pour curiethérapie combinée à une série d'irradiations externes chez un patient qui répond aux critères ou pathologie repris en catégorie 6 | 01-06-2001 | |
| 444334-444345 | Honoraires forfaitaires pour un traitement conventionnel (röntgenthérapie de 200 à 300 KV, thérapie de contact de 50 KV) de 1 à 15 fractions chez un patient qui répond aux critères ou pathologie repris en catégorie 11 | 01-06-2001 | |
| 444356-444360 | Honoraires forfaitaires pour les préparations avec simulation d'un traitement par irradiation externe ou de curiethérapie, par série d'irradiation pour un patient de catégorie 1, 2, 3, 4, 4bis,5, 6, 7 ou 8, la première simulation, excepté pour les patients de catégorie 8 avec un traitement pour cancer de la prostate par implantation permanente de grains d'iode radioactifs | 01-06-2001 | |
| 444371-444382 | Honoraires forfaitaires pour les préparations avec simulation d'un traitement par irradiation externe ou de curiethérapie, par série d'irradiation pour un patient de catégorie 2, 3, 4, 4bis, 5, 6 ou 8, deuxième simulation | 01-06-2001 | |
| 444393-444404 | Honoraires forfaitaires pour le calcul de la distribution de la dose individuelle d'un traitement par irradiation externe ou de curiethérapie chez des patients de catégorie 1, 2, 3, 4, 4bis, 5, 6, 7 ou 8, premier planning | 01-06-2001 | |
| 444415-444426 | Honoraires forfaitaires pour le calcul de la distribution de la dose individuelle d'un traitement par irradiation externe ou de curiethérapie chez des patients de catégorie 2, 3, 4, 4bis, 5, 6 ou 8 , deuxième planning | 01-06-2001 | |
| 444430-444441 | Honoraires supplémentaires lors de la prestation 444393 - 444404 (premier planning) pour le calcul de la distribution tridimensionnelle de la dose individuelle pour irradiation externe chez des patients de catégorie 3, 4, 4bis | 01-06-2001 | |
| 444452-444463 | Honoraires supplémentaires lors de la prestation 444393 - 444404 (premier planning) pour le calcul de la dose individuelle avec utilisation d'un programme de modulation d' intensité pour irradiation avec un collimateur multi-lames chez des patients de catégorie 3, 4, 4bis | 01-06-2001 | |
| 444474-444485 | Honoraires pour gammagraphie chez un patient de catégorie 1, 2, 3 ou 4 traité par irradiation externe, maximum 4 par série d'irradiation | 01-06-2001 | |
| 444496-444500 | Honoraires pour imagerie portale en ligne chez un patient de catégorie 1, 2, 3, 4, 4bis traité par irradiation externe, maximum 4 par série d'irradiation | 01-06-2001 | |
| 444511-444522 | Honoraires pour dosimétrie in vivo chez des patients de catégorie 1, 2, 3, 4, 4bis traités par irradiation externe, maximum 4 par série d'irradiation | 01-06-2001 | |
| 444533-444544 | Honoraires supplémentaires pour irradiation avec un collimateur multi-lames chez des patients de catégorie 3, 4, 4bis, par série d'irradiation | 01-06-2001 | |
| 444555-444566 | Honoraires supplémentaires pour curiethérapie avec utilisation d'un système de chargement différé avec projecteur automatique de sources chez des patients de catégorie 5, 6, 7 ou 8,par série d'irradiation | 01-06-2001 | |
| 444570-444581 | Masques ou systèmes de fixation individuelle lors d'irradiation externe chez des patients de catégorie 1 pour localisations tête et cou et chez des patients de catégorie 2, 3, 4, 4bis, par série d'irradiation | 01-06-2001 | |
| 444592-444603 | Blocs individualisés pour traitement par irradiation externe et/ou par curiethérapie des patients de catégorie 1, 2, 3, 4, 5, 6, 7 ou 8, par série d'irradiation | 01-06-2001 | |
| 444614-444625 | CT de localisation effectuée lors de la prestation 444356-444360 (1re simulation) et/ou de la prestation 444371-444382 (2e simulation) | 01-08-2017 | |
| 444636-444640 | Honoraires forfaitaires pour une série d’irradiations stéréotaxiques chez un patient qui répond aux critères repris dans la catégorie 4bis, tumeurs primaires, à l’exception de tumeurs cérébrales | 01-01-2020 | |
| 444651-444662 | Honoraires forfaitaires pour une série d’irradiations stéréotaxiques chez un patient qui répond aux critères repris dans la catégorie 4bis, oligométastases, à l’exception de métastases cérébrales | 01-01-2020 | |
| 444673-444684 | Honoraires forfaitaires pour une série d’irradiations stéréotaxiques chez un patient qui répond aux critères repris dans la catégorie 4bis, tumeurs cérébrales malignes et métastases cérébrales | 01-01-2020 | |
| 444695-444706 | Honoraires forfaitaires pour une série d’irradiations stéréotaxiques chez un patient qui répond aux critères repris dans la catégorie 4bis, tumeurs cérébrales non malignes et malformations artério-veineuses (MAV) | 01-01-2020 | |
| 444710-444721 | Irradiation du sein via hypofractionnement (5 fractions) avec modulation d'intensité (IMRT) dans le cadre du COVID19 | 14-03-2020 |
The codes mentioned above can be used in rates and expenses, or only in expenses. We invite you to consult the full report for more information.
Below is a graph showing the evolution of the breakdown by volume of nomenclature codes used for the rates:
")
Population selection
No selection
Analysis period
2024
Graphics
 Nomenclature codes
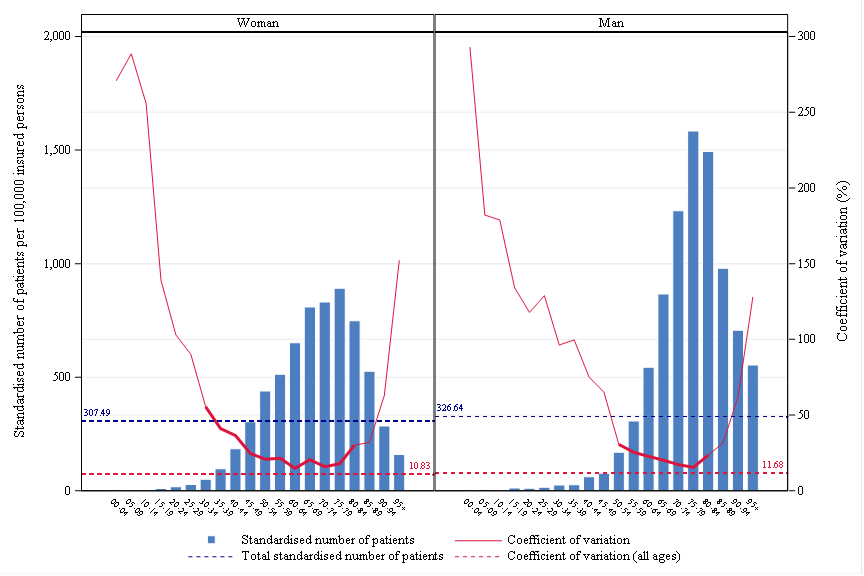
 Age, gender and CV
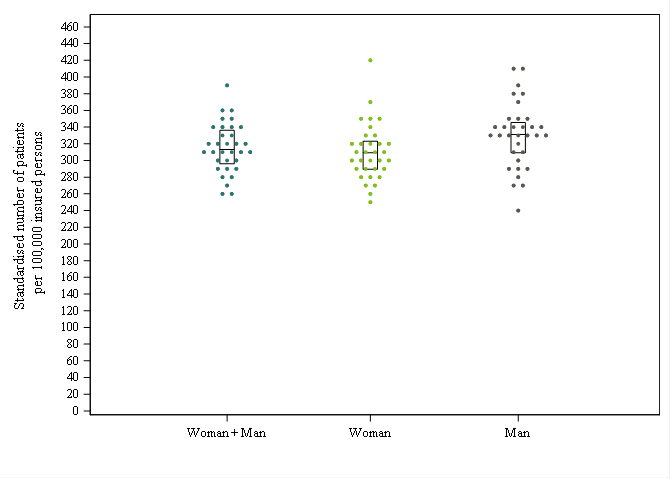
 Rates by sex
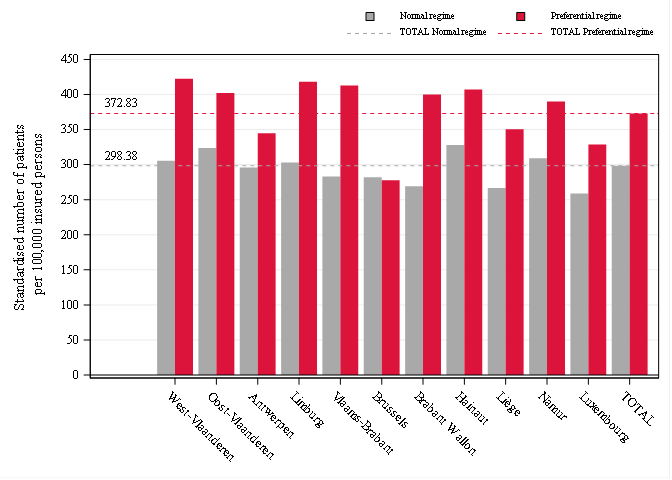
 Reimbursement rate
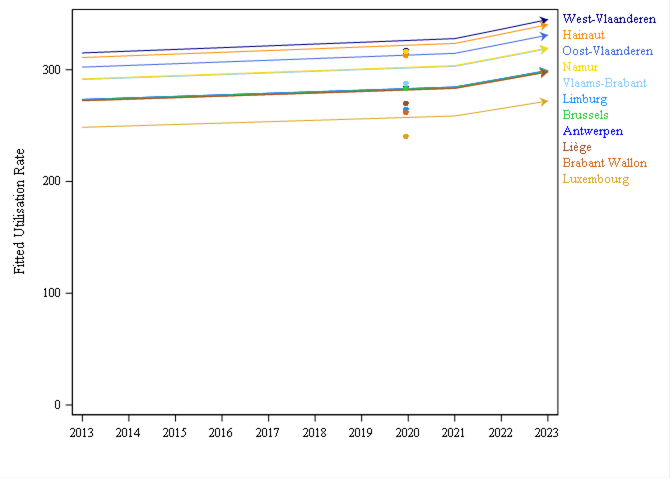
 Trends by region
 Trends break
 Dot Plot
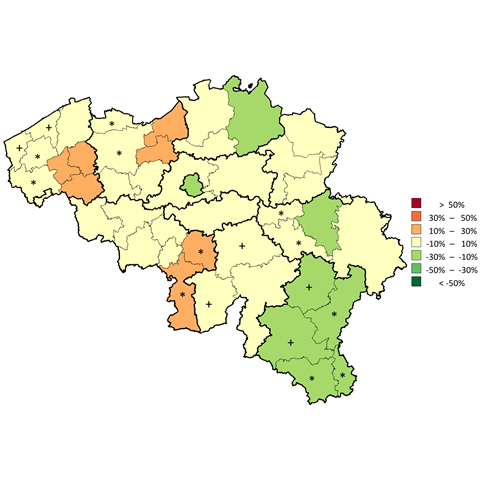
 Distribution map
 Expenses Distribution map
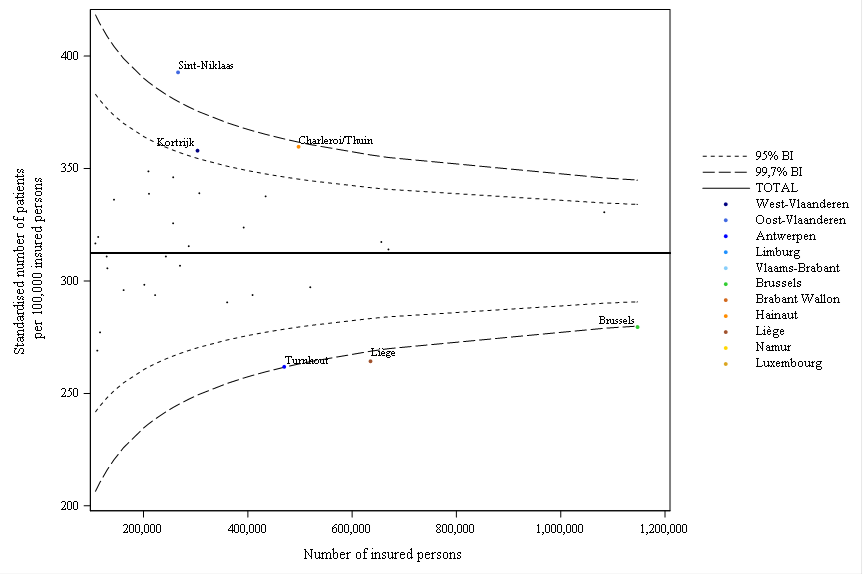
 Funnel plot
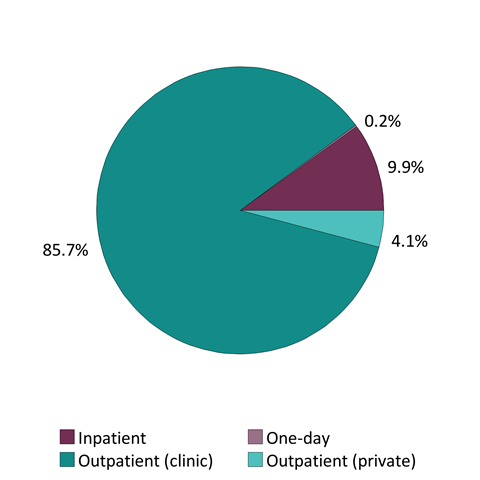
 Patient care settings
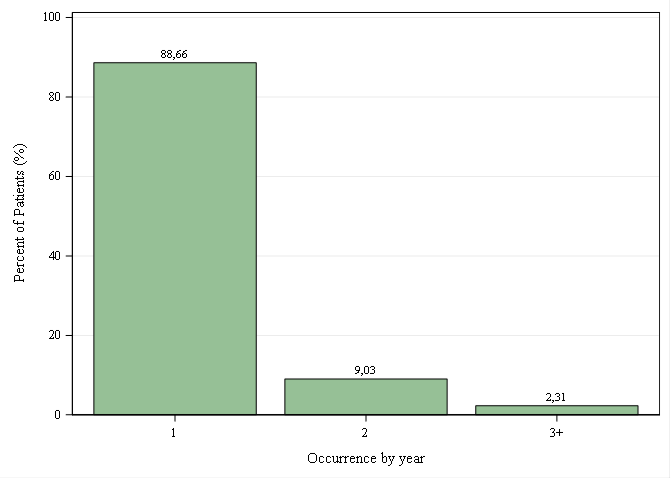
 Occurrences per year
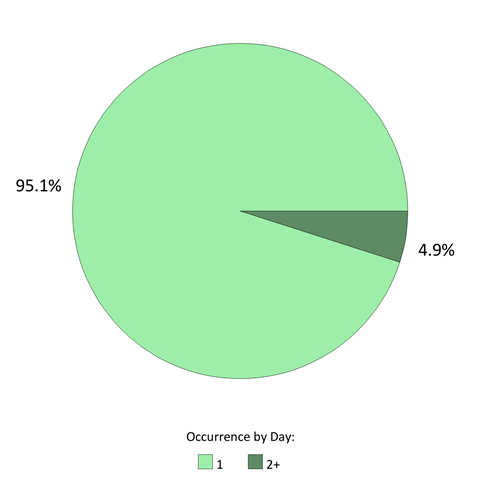
 Occurrences per day


Comments
WE ARE INTERESTED IN YOUR OPINION
Do you have any experience in this area ? We listen to you !