Key figures
On this table, when a statistical test has been performed, the data showing a significant difference is displayed on a yellow background, otherwise on a grey background.
The geographical dispersion marker Δ shows the result of comparing the coefficient of variation (CV) of the indicator with the median (MED) of the CVs of all analyses for this indicator: δ if CV > MED + 10%, δδ if CV > MED + 20%, δδδ if CV > MED + 30% (Exception: For median age, δ means CV > MED + 30%).
Data
NIHDI nomenclature codes selected for analysis
| CODES | LABEL | CREATION | DELETION |
| 453574-453585 | Coronarographie digitale par cathétérisme cardiaque | 01-01-2012 | |
| 453596-453600 | Coronarographie digitale par cathétérisme cardiaque avec minimum deux séquences filmées par pontage | 01-01-2012 | |
| 464170-464181 | Coronarographie digitale par cathétérisme cardiaque | 01-01-2012 | |
| 464192-464203 | Coronarographie digitale par cathétérisme cardiaque avec minimum deux séquences filmées par pontage | 01-01-2012 | |
| 589934-589945 | Mesure de la Fraction Flow Reserve en cas de sténose intermédiaire de l’artère coronaire concernant un vaisseau | 01-01-2019 | |
| 589956-589960 | Ensemble des mesures de la Fraction Flow Reserve en cas de sténose intermédiaire de l’artère coronaire concernant de multiples vaisseaux | 01-01-2019 | |
| 590251-590262 | Coronarographie digitale par cathétérisme cardiaque suivie immédiatement d’une intervention coronarienne percutanée | 01-04-2023 | |
| 590273-590284 | Coronarographie digitale par cathétérisme cardiaque avec minimum deux séquences filmées par pontage suivie immédiatement d’une intervention coronarienne percutanée | 01-04-2023 |
The codes mentioned above can be used in rates and expenses, or only in expenses. We invite you to consult the full report for more information.
Below is a graph showing the evolution of the breakdown by volume of nomenclature codes used for the rates:
")
Population selection
No selection
Analysis period
2024
Graphics
 Nomenclature codes
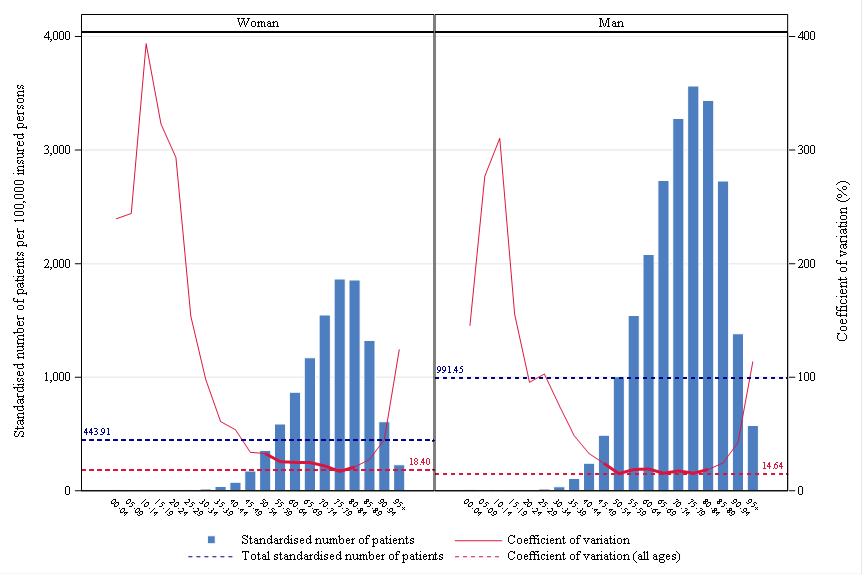
 Age, gender and CV
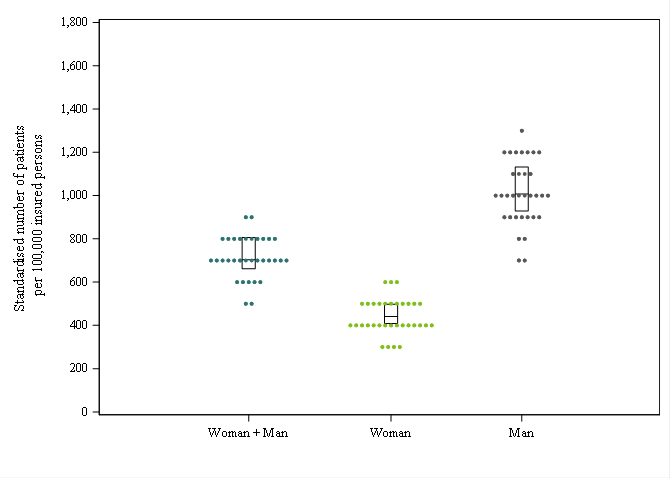
 Rates by sex
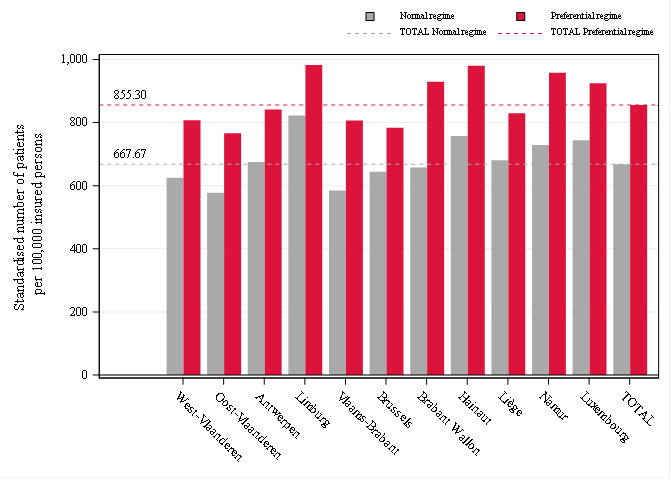
 Reimbursement rate
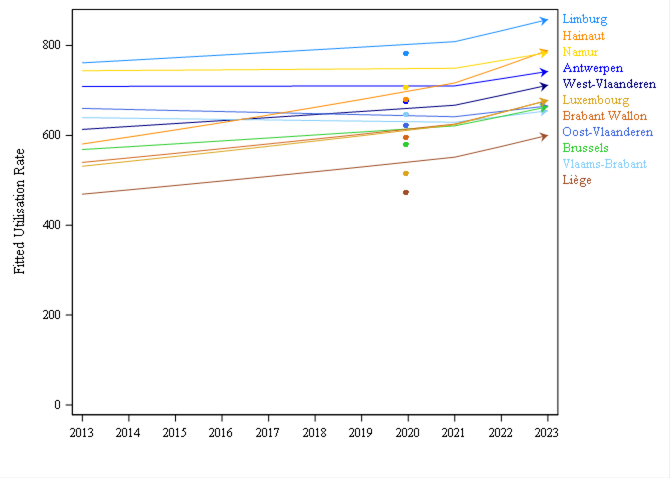
 Trends by region
 Trends break
 Dot Plot
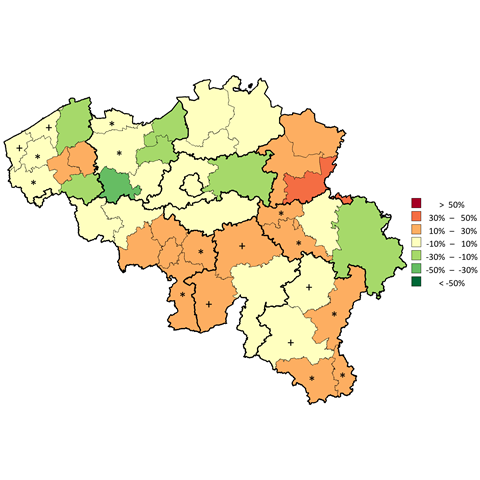
 Distribution map
 Expenses Distribution map
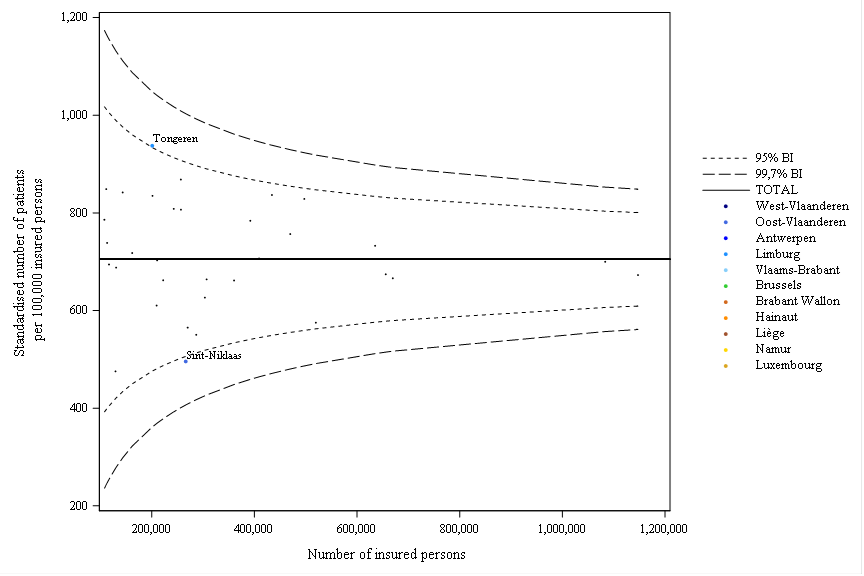
 Funnel plot
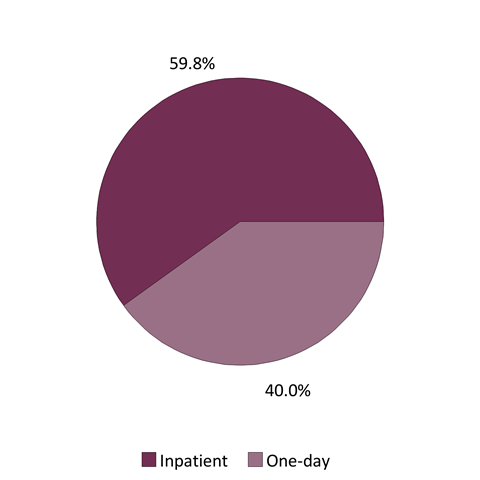
 Patient care settings
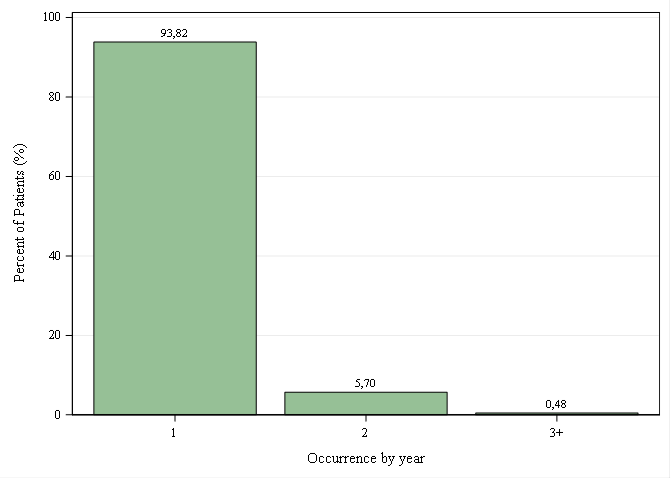
 Occurrences per year
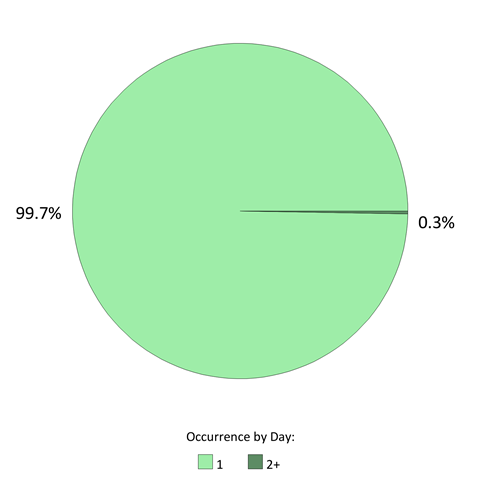
 Occurrences per day


Comments
WE ARE INTERESTED IN YOUR OPINION
Do you have any experience in this area ? We listen to you !