Key figures
On this table, when a statistical test has been performed, the data showing a significant difference is displayed on a yellow background, otherwise on a grey background.
Data
NIHDI nomenclature codes selected for analysis
| CODES | LABEL | CREATION | DELETION |
| 350276 350280 |
Concertation oncologique multidisciplinaire de suivi (COM de suivi), attestée par le médecin-coordinateur | 01-11-2010 | |
| 350291 350302 |
Concertation oncologique multidisciplinaire supplémentaire (COM supplémentaire) dans un hôpital autre que celui de la première COM, sur renvoi, attestée par le médecin-coordinateur | 01-11-2010 | |
| 350372 350383 |
Première consultation oncologique multidisciplinaire (première COM), attestée par le médecin-coordinateur | 01-02-2003 | |
| 350394 350405 |
Participation à la concertation oncologique multidisciplinaire | 01-02-2003 | |
| 350416 350420 |
° Participation à la concertation oncologique multidisciplinaire par un médecin qui n'est pas membre de l'équipe de médecins hospitaliers | 01-02-2003 | |
| 350453 350464 |
Supplément d'honoraires à la prestation 350372-350383, 350276-350280 et 350291-350302, attestable par le médecin spécialiste en oncologie médicale ou porteur du titre professionnel particulier en hématologie clinique ou en hématologie et oncologie pédiatriques, lorsque celui-ci coordonne la consultation oncologique multidisciplinaire | 01-03-2010 | |
| 350475 350486 |
Supplément d’honoraires à la prestation 350394-350405 ou 350416-350420, attestable par le médecin spécialiste en oncologie médicale ou porteur du titre professionnel particulier en hématologie clinique ou en hématologie et oncologie pédiatriques, lorsque celui-ci assiste à la consultation oncologique multidisciplinaire | 01-03-2010 |
The codes mentioned above can be used in rates and expenses, or only in expenses. We invite you to consult the full report for more information.
Below is a graph showing the evolution of the breakdown by volume of nomenclature codes used for the rates:
 (2023)")
Population selection
No selection
plastical surgery
Analysis period
2023
Graphics
 Nomenclature codes
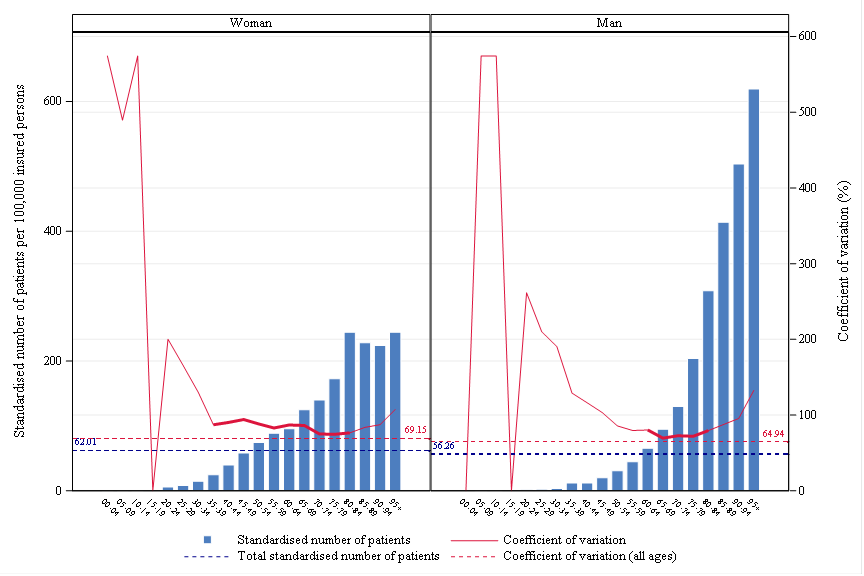
 Age, gender and CV
 Rates by sex
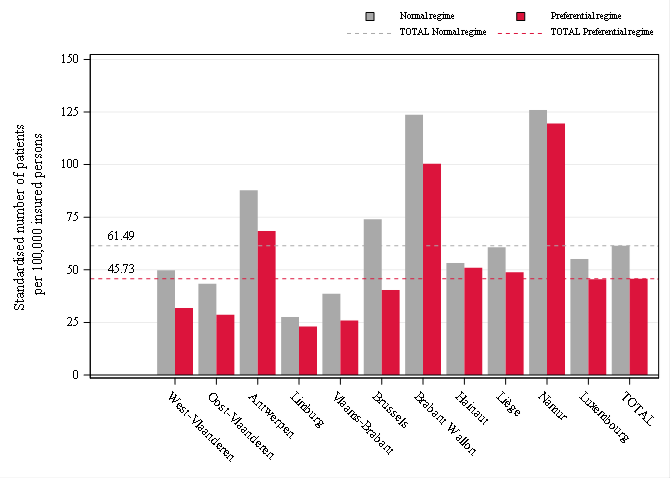
 Reimbursement rate
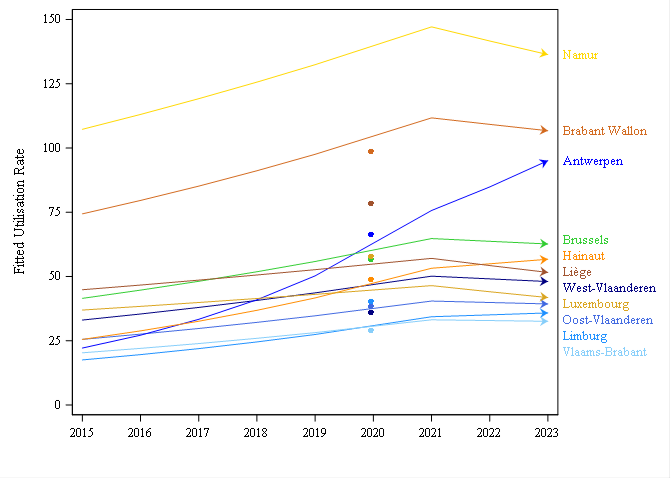
 Trends by region
 Trends break
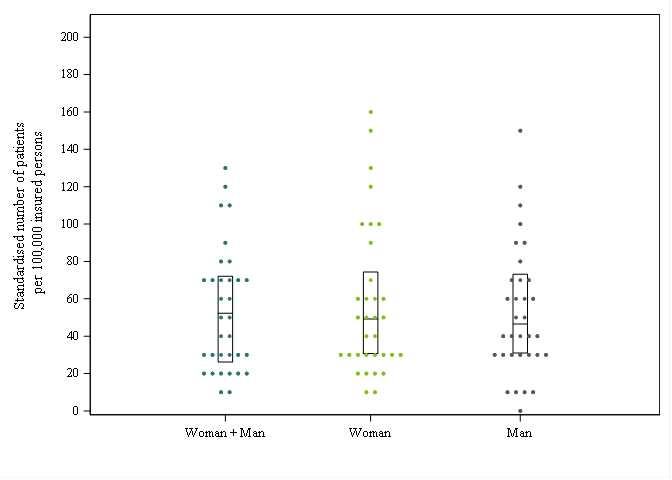
 Dot Plot
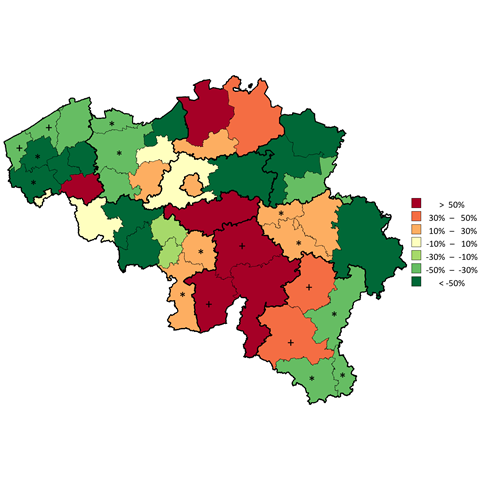
 Distribution map
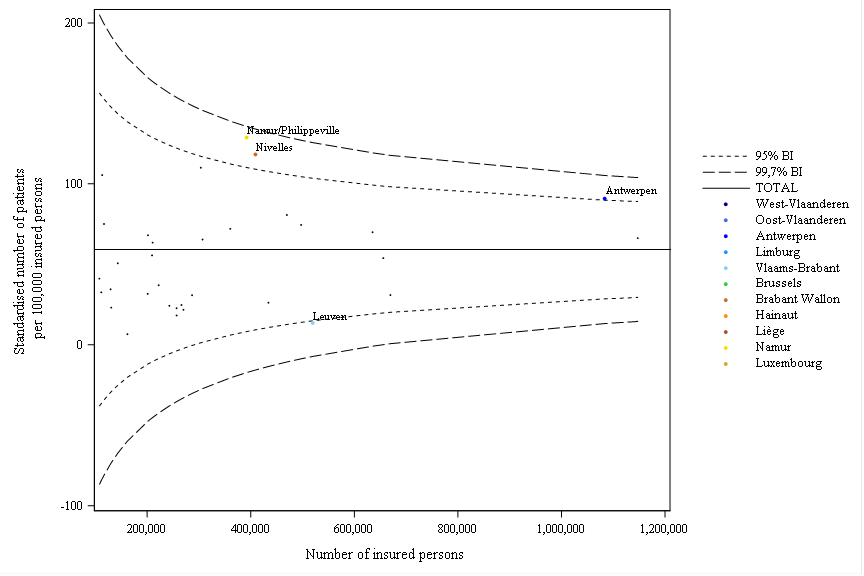
 Funnel plot
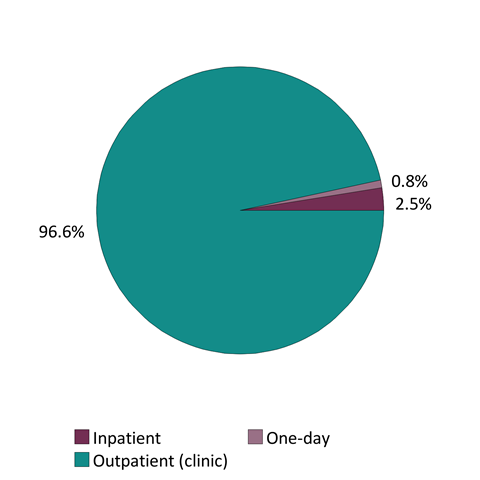
 Patient care settings
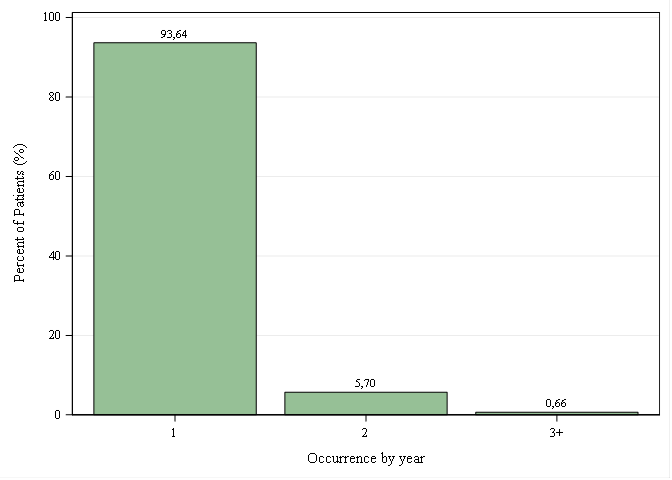
 Occurrences per year
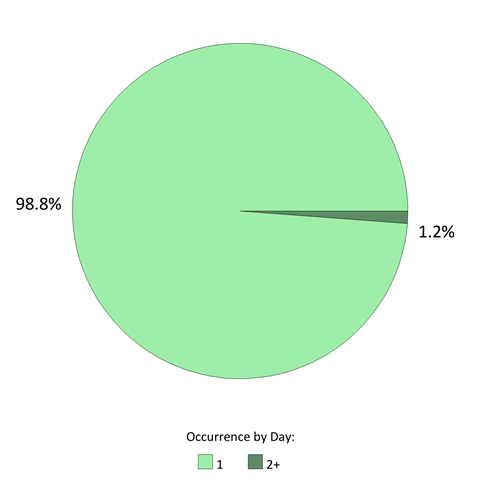
 Occurrences per day


Comments
WE ARE INTERESTED IN YOUR OPINION
Do you have any experience in this area ? We listen to you !