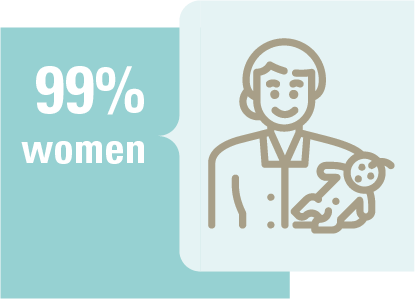
Midwifery is largely dominated by women, who make up 99% of the profession. In 2019, of the 8,416 active midwives, only 99 of them were male.
In 2019, 14,863 professionals were licensed to practise midwifery in Belgium. Of these, 57% were working in health care (i.e. 8,416 practising midwives), 14% were active outside the healthcare sector, 21% were not working in Belgium and 8% were retired.
Almost half of the midwives working in health care were under 35 years old.
DISTRIBUTION OF MIDWIVES BY ACTIVITY STATUS AND COMMUNITY, 2019
DISTRIBUTION OF ACTIVE MIDWIVES IN HEALTH CARE BY AGE, 2019
Two thirds of them were active in the Flemish Community and one third in the French Community. Most of them were working as employees in hospitals.
The density of midwives working in health care in Belgium was higher in the Flemish and Brussels-Capital Regions than in the Walloon Region (8.1 and 9.7 versus 5.2 respectively).
SECTOR OF ACTIVITY OF MIDWIVES WORKING IN HEALTH CARE IN 2019
|
FLEMISH COMMUNITY |
FRENCH COMMUNITY |
NUMBER OF MIDWIVES WORKING IN HEALTH CARE PER 10,000 INHABITANTS BY ACTIVITY DISTRICT (31/12/2019)
PROFESSIONAL STATUS OF MIDWIVES WORKING IN HEALTH CARE IN 2019
In the midwifery supply and demand projection exercise, we find that the need for midwifery care by 2037 is expected to remain stable while the number of midwives active in health care is projected to increase by just over 30% between 2020 and 2037 (in individuals and full-time equivalents).
SIZE OF EACH SEGMENT OF THE FEMALE POPULATION IN CURRENT AND FUTURE MIDWIFERY CARE IN RELATION TO ITS DEMOGRAPHIC CHANGE[1]
EVOLUTION OF THE NUMBER OF MIDWIVES ACTIVE IN HEALTH CARE AS INDIVIDUALS AND FULL-TIME EQUIVALENTS FROM 2004 TO 2019 AND PROJECTIONS TO 2042
[1]Explanation of the weighted population: the 'gross' population projections by the Federal Planning Bureau and the Belgian Statistical Of-fice are multiplied by a consumption rate based on consumption rate based on the consumption of care "honoraria of midwives" by the NIHDI. The average total amount reimbursed by the NIHDI is calculated per community and is the reference value. The rate of health care consumption for each segment of the population is then calculated in relation to this reference value.

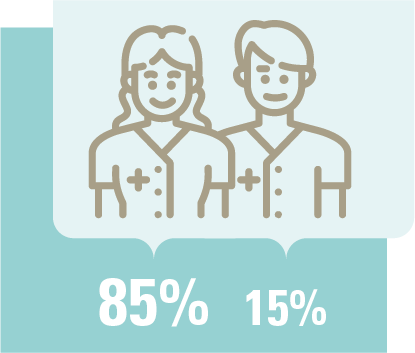
Traditionally, the professional nursing group has been composed primarily of women. Belgium has approximately 85% female nurses. This percentage has been stable for many years.
In 2018, 214,374 professional practitioners were licensed to practise nursing in Belgium. Of these licensed professionals, 59% (or 126,496 nursing practitioners) were active in the healthcare sector, 10% were active outside the healthcare field, 15% were not working in Belgium and 15% were already retired.
The age pyramid shows an even distribution of nurses by age.
DISTRIBUTION OF NURSES BY ACTIVITY STATUS AND COMMUNITY, 2018
DISTRIBUTION OF NURSES ACTIVE IN HEALTH CARE BY AGE AND GENDER, 2018
The professional group is also divided equally between the different Communities. 60% of the nurses working in health care work in the Flemish Community and 40% in the French Community. Each year, just over 2,000 individuals are added to the number of nurses working in the healthcare field.
Most nurses had a salaried professional status (83%) and mainly worked in a hospital. The nursing and care home sector and the home nursing sector completed the top 3.
The density of the number of nurses working in health care was slightly higher in the Flemish Community (113.6 per 10,000 inhabitants) than in the French Community (109).
SECTOR OF ACTIVITY OF NURSES WORKING IN HEALTH CARE IN 2018
NUMBER OF NURSES WORKING IN HEALTH CARE PER 10,000 INHABITANTS BY ACTIVITY DISTRICT (31/12/2018)
PROFESSIONAL STATUS OF NURSES WORKING IN HEALTH CARE IN 2018
In the nurse supply and demand forecasting exercise, we find that nursing needs between now and 2038 will increase sharply for the age categories 65 and older. At the same time, an increase of just over 25% in the number of nurses working in health care is expected.
SIZE OF EACH SEGMENT OF THE POPULATION IN CURRENT AND FUTURE NURSING CARE IN RELATION TO ITS DEMOGRAPHIC CHANGE[1]
EVOLUTION OF THE NUMBER OF NURSES ACTIVE IN HEALTH CARE AS INDIVIDUALS AND FULL-TIME EQUIVALENTS FROM 2004 TO 2018 AND PROJECTIONS TO 2043
[1]Explanation of the weighted population: the 'gross' population projections by the Federal Planning Bureau and the Belgian Statistical Of-fice are multiplied by a consumption rate based on consumption rate based on the consumption of care "honoraria of nurses" by the NIHDI. The average total amount reimbursed by the NIHDI is calculated per community and is the reference value. The rate of health care consumption for each segment of the population is then calculated in relation to this reference value.

In 2019, there were 17,565 professional practitioners licensed to practise as a "speech therapist" in Belgium. Of these, 65% were working in the healthcare sector (11,494 speech therapists), 11% outside the healthcare sector, 18% not working within Belgium and 5% were retired. Of these speech therapists working in health care, 58% worked in the Flemish Community and 42% in the French Community.
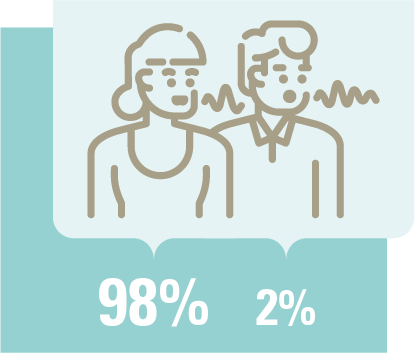
The profession was quite young and female, as 46% of speech-language pathologists working in the healthcare sector were under 35 years of age and 98% of them women.
DISTRIBUTION OF SPEECH THERAPISTS BY ACTIVITY STATUS AND COMMUNITY, 2019
DISTRIBUTION OF SPEECH THERAPISTS IN HEALTH CARE BY AGE, 2019
Most speech therapists had an exclusively salaried professional status and mainly worked in teaching.
OCCUPATIONAL STATUS AND SALARIED SECTOR OF ACTIVITY FOR SPEECH THERAPISTS WORKING IN HEALTH CARE IN 2019[1]
FLEMISH COMMUNITY
FRENCH COMMUNITY
NUMBER OF SPEECH THERAPISTS WORKING IN HEALTH CARE PER 10,000 INHABITANTS BY ACTIVITY DISTRICT (31/12/2019)
The density of speech therapists working in health care per 10,000 inhabitants in Belgium differed between the districts, with, for example, a low density in Tongeren and a high density in Ghent, and was more pronounced in the Brussels-Capital Region than in the other Regions (9.60 in the Flemish Region; 9.76 in the Walloon Region; 12.71 in the Brussels-Capital Region).
EVOLUTION OF THE NUMBER OF SPEECH THERAPISTS IN HEALTH CARE AS INDIVIDUALS AND FULL-TIME EQUIVALENTS FROM 2013 TO 2019
On average, based on the change between 2013 and 2019, the number of active speech therapists in health care increased by just over 450 individuals per year.
[1]The sectors of employment are known for speech therapists with an employed status but not for the self-employed speech therapists.
